Advertise Here

View All Articles

Satellite View of Changing Arctic

Median Artic Sea Ice change 1981-2014 Image

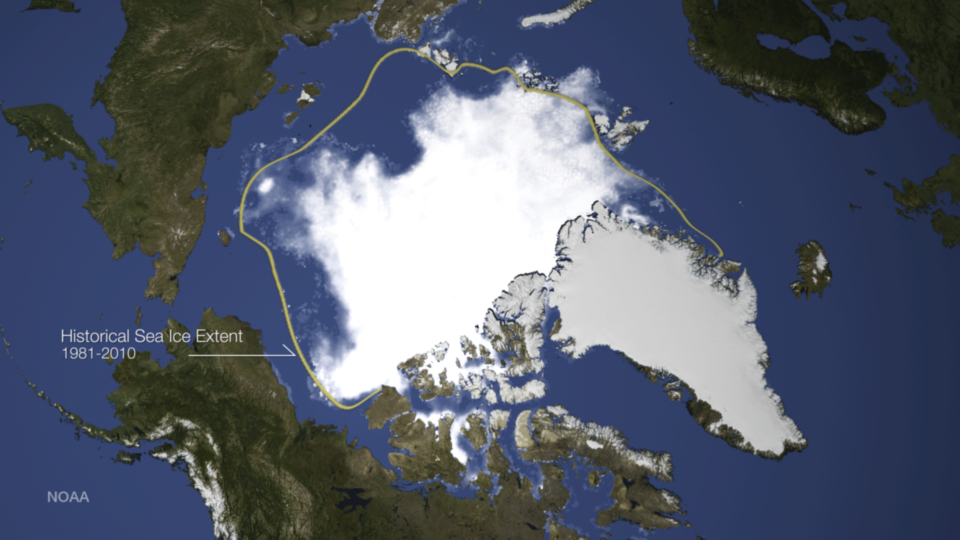
This image shows the sea ice concentration on September 17, 2014, along with a yellow line indicating the median sea ice extent for 1981-2010. Credit: NOAA

According to analysis by the National Snow and Ice Data Center, sea ice in the Arctic reached its annual minimum on September 17, 2014. At 5.02 million square kilometers or 1.94 million square miles, this was the sixth lowest amount of ice on record since satellite observations began in 1979. This image, using microwave data from the SSMIS sensor on the DMSP satellites, shows the sea ice concentration on September 17, 2014, along with a yellow line indicating the median sea ice extent for 1981-2010.

This entry was posted in Weather Articles and tagged , , , , , . Bookmark the permalink.

Leave a Reply

Read More

Thunderstorm Fundamentals Thumbnail

Thunderstorm Basics: Structure, Types, and Forecasting Methods

Thunderstorms are among the most powerful weather events on Earth. They can bring much needed rainfall, yet they also produce dangerous hazards such as lightning, hail, flash flooding, and tornadoes. Understanding how storms form, how they…

Read More

NOAA Tsunami Research

How 30 Years of NOAA R&D Made a Tsunami Forecast Land Exactly When It Mattered   Event in brief. In late July 2025, a magnitude 8.8 megathrust earthquake off Russia’s Kamchatka Peninsula triggered Pacific-wide tsunami alerts.…

Read More

Alert.com Saffir-Simpson Hurricane Wind Scale

Saffir-Simpson Hurricane Wind Scale

The Saffir-Simpson Hurricane Wind Scale is a 1 to 5 rating based on a hurricane’s sustained wind speed. This scale estimates potential property damage. Hurricanes reaching Category 3 and higher are considered major hurricanes because of…

Read More

Leave a Reply