| Enhanced Fujita (EF) Tornado Scale | |
| EF Number | Typical Damage |
| EF 0 (65-85mph) | Light damage: Peels surface off some roofs; some damage to gutters or siding; branches broken off trees; shallow-rooted trees pushed over. |
| EF 1 (86-110mph) | Moderate damage: Roofs severely stripped; mobile homes overturned or badly damaged; loss of exterior doors; windows and other glass broken. |
| EF 2 (111-135mph) | Considerable damage: Roofs torn off well-constructed houses; foundations of frame homes shifted; mobile homes completely destroyed; large trees snapped or uprooted; light-object missiles generated; cars lifted off ground. |
| EF 3 (136-165mph) | Severe damage: Entire stories of well-constructed houses destroyed; severe damage to large buildings such as shopping malls; trains overturned; trees debarked; heavy cars lifted off the ground and thrown; structures with weak foundations blown away some distance. |
| EF 4 (166-200mph) | Devastating damage: Whole frame houses Well-constructed houses and whole frame houses completely leveled; cars thrown and small missiles generated. |
| EF 5 (>200 mph) | Incredible damage: Strong frame houses leveled off foundations and swept away; automobile-sized missiles fly through the air in excess of 100 m (109 yd); high-rise buildings have significant structural deformation; incredible phenomena will occur. |
What is the Fujita tornado damage scale or fujita scale?
The Fujita Tornado Damage Scale (F-Scale) was developed by University of Chicago Professor Dr. T. Theodore Fujita in 1971 to estimate tornado strength based on damage of homes hit by tornados. On February 1, 2007 the National Weather Service updated the F-Scale to the Enhanced Fujita Scale (EF-Scale) which classifies tornados based on 28 different structures including trees, mobile homes, and other types of buildings. The EF range of tornado intensities remains as before, zero to five, with ‘EF0’ being the weakest, associated with very little damage and ‘EF5’ representing complete destruction.
This entry was posted in iAlert FAQ and tagged EF-Scale, enhanced fujita scale, fujita tornado, theodore fujita, tornado damage, tornado intensities, tornado scale, tornado strength, tornados. Bookmark the permalink.
Read More
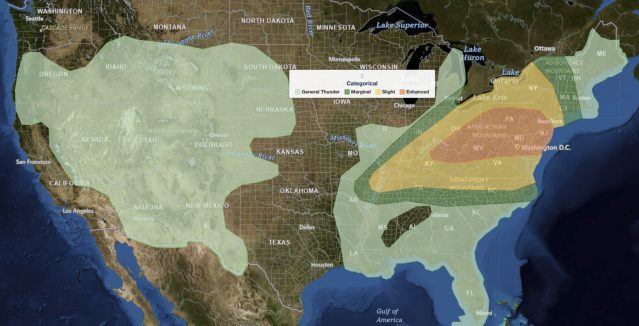
Upper Ohio Valley Severe Weather: Enhanced Risk July 21, 2026
Upper Ohio Valley severe weather is the headline threat on July 21, 2026, as the NOAA Storm Prediction Center (SPC) has issued an Enhanced Risk stretching from the Ohio Valley through the Mid-Atlantic and into the…
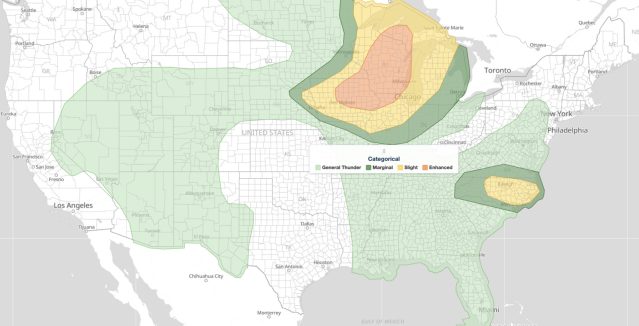
Upper Midwest Severe Thunderstorms: Enhanced Risk July 20, 2026
Upper Midwest severe thunderstorms are threatening Minnesota, Wisconsin, Iowa, Upper Michigan, and the broader Great Lakes region today, July 20, 2026, with the NOAA Storm Prediction Center placing the area under an Enhanced Risk, the third…
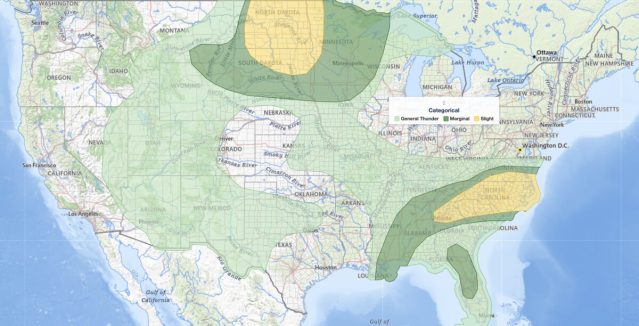
Southeast Severe Thunderstorms and Dakotas Hail Threat: SPC Outlook for July 19, 2026
Southeast severe thunderstorms are the lead hazard in today's Storm Prediction Center Day 1 Convective Outlook, issued July 19, 2026, with the SPC placing a Slight Risk, the second of five severe categories (level 2 of…