Forecast Analysis Workspace

Weather Analysis Visualization Environment (WAVE)

Operational models, dual-polarization radar, satellite, and a full sounding toolkit in one synced multi-pane display. Inspired by AWIPS CAVE, the workstation National Weather Service forecasters work in every day.

  • GFS, HRRR, and ECMWF, with every ingested field from the surface to 100 mb
  • Point-click Skew-T soundings with CAPE, CIN, shear, and hodographs
  • Single-site Level II radar: reflectivity, velocity, ZDR, and correlation coefficient
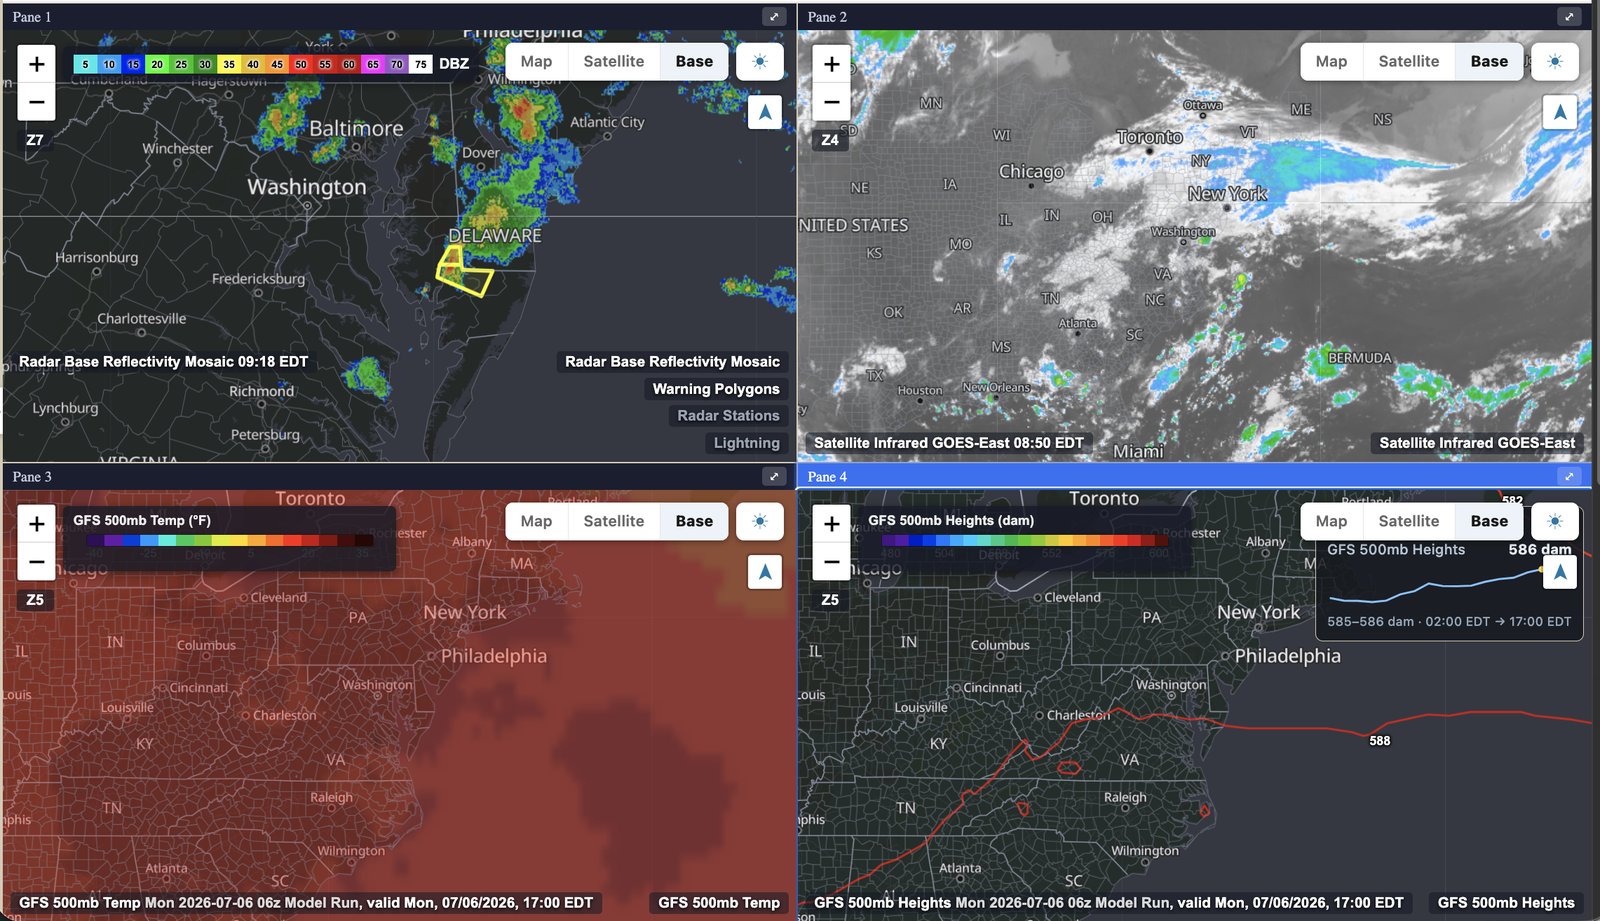
Real console output: radar mosaic with warning polygons, GOES-East infrared, and GFS 500 mb temperature and heights, synced across four panes.
Where the data comes from

WAVE renders named, operational data: the GFS and HRRR from NOAA / NCEP, the ECMWF, NEXRAD Level II and MRMS radar, GOES-East and GOES-West imagery, GLM lightning, and official NWS watches and warnings. No blended black box. You see the model, the run, and the field, by name.

How It Works

Load a model. Sync the panes. Loop the forecast.

  1. 01

    Load

    Pick a field from menus organized the way forecasters work: Surface, Upper Air, Models, Obs, Hazards. Load it onto a pane and WAVE pulls the latest run for you, so you are always on current data.

  2. 02

    Sync

    Link the panes: pan one and the rest follow, with a shared crosshair marking the same spot in every pane. Zoom stays independent, so a regional view can sit next to a storm-scale view of the same system.

  3. 03

    Loop

    Press play and every pane animates in lockstep (a loop, in forecaster terms), or loop a single pane alone. Step one frame at a time when you want to slow a system down.

What You Get

A workspace, not a weather widget.

WAVE names the model, exposes the run, and lets you interrogate the data. That is the line between a professional tool and a consumer app.

Three Operational Models

NOAA's global GFS, the storm-scale HRRR, and the ECMWF, ingested run by run. Curated menus cover the fields you reach for first; the Field Browser opens every parameter the run carries.

  • Surface: MSLP, 2 m temp and dew point, wind, gusts, CAPE, precip type
  • Aloft: heights, temps, RH, wind, vorticity, theta-e by pressure level

Synced Multi-Pane Compare

One, two, four, or a six-pane 3×2 grid. Linked panning and a shared crosshair keep every pane on the same spot while each holds its own zoom. Stage extra views on the five-slot side rail and swap them in.

  • 1 / 2 / 4 / 3×2 layouts
  • Crosshair cursor mirrored across panes

Level II Radar, GOES East & West

A national MRMS mosaic that hands off to single-site NEXRAD Level II as you zoom in. Dual-polarization products at the radar's native detail, with GOES GeoColor, infrared, and visible alongside.

  • Reflectivity, velocity, ZDR, correlation coefficient
  • NWS warning polygons drawn automatically

Probe, Measure, Export

Hover any model layer for live values; click to lock a point and get a time series across the loop. Drop pins, measure distance, project a storm path, and export any pane as an MP4 clip.

  • US or metric units, UTC and U.S. time zones
  • MP4 export up to 1080p, plus vertical framing
The Model Catalog

Know exactly what you are looking at.

Three operational models, each with its own job. WAVE shows you which one you are viewing, when it ran, and every field the run carries.

GFS

Global Forecast System

Global · Deterministic

The workhorse global model and the baseline for medium-range pattern work. Run it next to the ECMWF and watch how the two solutions converge, or don't, run over run.

Agency
NOAA / NCEP
Resolution
~13 km
Update cycle
4× daily (00 / 06 / 12 / 18 UTC)
In WAVE
Full surface + upper-air suite

The Field Browser lists every parameter each run carries as it lands in the feed, with pressure levels from 1000 mb up to 100 mb and precipitation windows from 1 to 120 hours. Next on the model roadmap: the National Blend of Models (NBM) and the GEFS ensemble.

The Analysis Toolkit

Interrogate the atmosphere, not just the map.

Plan-view maps show you where. Soundings and cross-sections show you why. WAVE builds both from the same model grids you are looking at.

Skew-T at Any Point

Right-click anywhere on a model pane and WAVE builds a full Skew-T log-p sounding from that model at the forecast hour on screen. Move through the run and watch the profile evolve.

  • Temperature, dew point, and wind profile from the loaded grid
  • Works with GFS, HRRR, and ECMWF

Hodographs & Derived Indices

Every sounding comes with a hodograph colored by height layer and the numbers you would compute by hand: parcel indices, bulk shear, and moisture depth, updated as you step the forecast.

  • SBCAPE, CIN, lifted index, K-index
  • 0–1 km and 0–6 km bulk shear, precipitable water, freezing level

Vertical Cross-Sections

Click point A, click point B, and WAVE slices the model along your line: a shaded height-by-distance section with wind barbs, steppable through the forecast hours.

  • Temperature, theta-e, RH, or wind speed
  • Frontal zones, inversions, and dry slots in profile view

Observed Soundings (RAOB)

Real radiosonde launches from sites across the U.S. and Caribbean, on the same Skew-T display as the model profiles. Check the 00Z or 12Z balloon against what the model thinks, apples to apples.

  • Upper-air network sites, 00Z / 12Z launches
  • Same hodograph and index suite as model soundings
Data Layers

Situational awareness, layer by layer.

Stack observations and hazards over any model field, on any pane, synced to the loop.

Radar

National mosaic to single-site detail, automatically.

  • MRMS mosaic: base and composite reflectivity
  • Single-site NEXRAD Level II, auto-selected as you zoom in
  • Dual-pol: base velocity, ZDR, correlation coefficient
  • NWS warning polygons drawn with the radar, automatically

Satellite & Lightning

GOES-East and GOES-West, frame-synced.

  • GeoColor day/night composite
  • Infrared (Band 13) and Visible (Band 2)
  • GLM lightning strikes, synced to the loop

Hazards & Outlooks

The convective picture before and during the event.

  • SPC convective outlooks, Day 1–3 categorical
  • Tornado, hail, and wind probability sub-layers
  • Active NWS alerts shaded by county and zone

Reports & Tropical

Ground truth and the basin-scale view.

  • Storm reports from the last 24 hours: tornado, hail, wind
  • Tropical cyclone cones, tracks, and positions
  • Radar station markers and county lines
  • Surface station plots and METARs on deck
Try It

Drive the console, right here.

A scaled-down replica of the workspace, with several products wired to real console output. Click a pane to select it, then load a product from the menus. The full console adds live data, looping, and every product in the catalog.

Reflectivity (Mosaic)
Single-Site (Level II)
GOES-East
GOES-West
MSLP
2m Temperature
10m Wind
CAPE
Precip Type
500mb Temperature
500mb Heights
500mb Vorticity
500mb Wind
850mb Theta-e
300mb Wind
1000–500mb Thickness
GFS
HRRR
ECMWF
 
Preview
Pane 1
Pane 2
Pane 3
Pane 4

By the numbers.

  • 3 Operational models: GFS, HRRR, ECMWF
  • 4 Level II radar products, dual-pol included
  • 12 Pressure levels, 1000 to 100 mb
  • 6 Synced panes in the 3×2 layout
Questions, answered

Before you subscribe.

Which models does WAVE include?
GFS, HRRR, and ECMWF, ingested run by run. The curated menus carry the core surface and upper-air fields, and the Field Browser lists every parameter each run carries beyond that. The National Blend of Models and the GEFS ensemble are next on the ingest roadmap.
Is the radar Level II or Level III?
Level II, rendered per site. At wide zoom you get the national MRMS mosaic; zoom into a storm and WAVE hands off to the nearest NEXRAD site with base reflectivity, base velocity, differential reflectivity, and correlation coefficient. You can also lock a specific site. Warning polygons draw automatically with the radar.
Are the soundings model-derived or observed?
Both. Right-click any model pane for a forecast Skew-T from that model at the hour on screen, and load observed radiosonde (RAOB) soundings from upper-air sites at 00Z and 12Z. Both use the same display: Skew-T log-p, hodograph, and the derived index suite.
How current is the data?
Each model updates on its own schedule: the HRRR refreshes hourly, the GFS runs four times a day, and the ECMWF runs at 00Z and 12Z. WAVE loads the latest available run for whatever you pull up. Radar mosaic, single-site Level II, and satellite loops carry the most recent frames and refresh continuously.
Do I need to be a meteorologist to use WAVE?
No, but WAVE will not hide the data from you either. The model catalog explains what each model is for in plain terms, the default views are ready to loop, and the derived indices are computed and labeled so you can learn what the numbers mean by watching them change.
Can I export imagery or video?
Yes. Any pane can be exported as an MP4 clip of its current loop, with framing presets for standard HD, 1080p, and vertical phone video. Clips carry iAlert branding and data attribution.
Does WAVE run on phones or tablets?
WAVE is a desktop browser tool and needs a screen at least 1024 pixels wide. There is nothing to install: it runs in a modern browser on your desktop or laptop. A phone screen cannot hold a multi-pane workspace, and we would rather say that plainly than ship a cramped one.
Can I use WAVE alongside my iAlert alerts?
Yes. WAVE is a separate subscription that sits next to any iAlert alert services you already have. Watch the setup develop in WAVE; let your alert subscriptions notify you when something crosses your thresholds.
Can I use WAVE imagery commercially or on-air?
[GAP] Commercial and broadcast use terms are pending. Peer tools gate redistribution behind a separate commercial license; WAVE's position on this is not yet set. Contact iAlert support for current terms.
How do I cancel?
Cancel anytime from your iAlert account. The subscription ends at the close of the current billing month and no further charges occur.

Ready when you are

Put a forecaster's workspace in your browser.

$15.00 per month. Instant access. Cancel anytime from your account.