View All Articles

How to Use the National Hurricane Center Cone Graphic


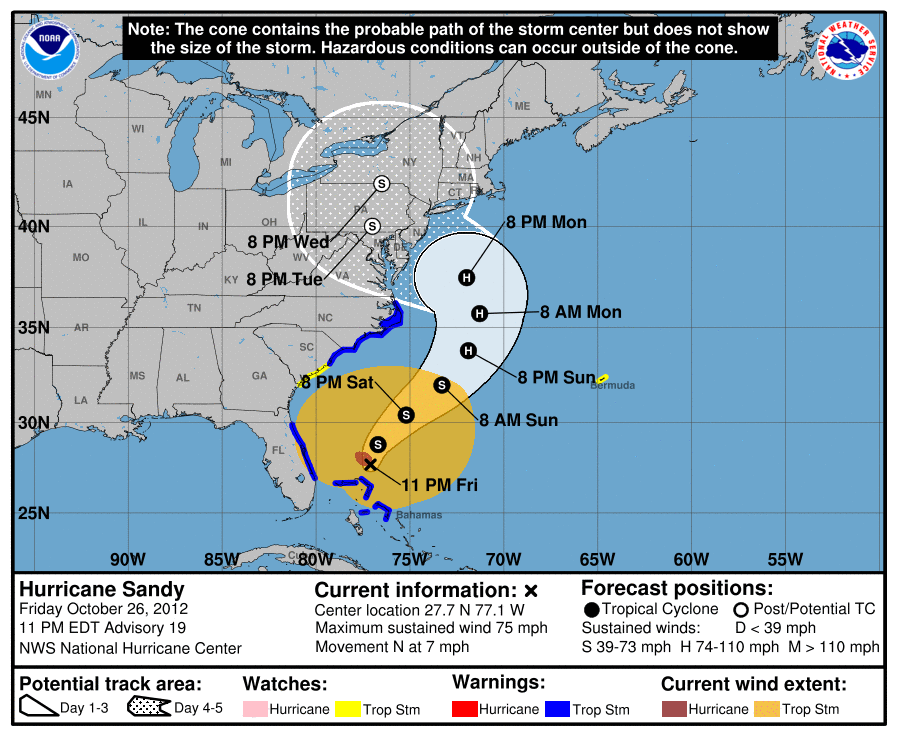
The National Hurricane Center cone graphic shows the areas potentially being affected by the sustained winds of tropical storm force (in orange) and hurricane force (in red). The display is based on the wind radii contained in the latest Forecast/Advisory. Users are reminded that the Forecast/Advisory wind radii represent the maximum possible extent of a given wind speed within particular quadrants around the tropical cyclone. As a result, not all locations falling within the orange or red shaded areas will be experiencing sustained tropical storm or hurricane force winds, respectively.

In addition to the wind field, this graphic shows an approximate representation of coastal areas under a hurricane warning (red), hurricane watch (pink), tropical storm warning (blue) and tropical storm watch (yellow). The white dot indicates the current position of the center of the tropical cyclone, and the dashed line shows the history of the center of the tropical cyclone.

Related Articles:

This entry was posted in Emergency Preparedness, Weather Articles and tagged , . Bookmark the permalink.

Leave a Reply

Read More

Northeast severe thunderstorms categorical outlook for July 14, 2026: SPC Enhanced Risk over northern New York, Vermont, and Maine.

Northeast Severe Thunderstorms Threaten Northern New York and New England on July 14

Northeast severe thunderstorms are set to impact northern New York and northern New England on July 14, 2026, as the NOAA Storm Prediction Center has issued an Enhanced Risk outlook covering the region. The Enhanced Risk…

Read More

Mid-Atlantic severe thunderstorms wind risk map for July 4, 2026, showing SPC damaging wind probabilities up to 45 percent near Washington DC, Maryland, Virginia, and southern New Jersey

Mid-Atlantic Severe Thunderstorms Put Washington DC in Highest Wind Risk for July 4 Fireworks

Mid-Atlantic severe thunderstorms are the top weather threat on Independence Day, July 4, 2026, and Washington DC sits squarely inside the highest damaging wind risk in the country. The NOAA Storm Prediction Center has issued an…

Read More

Northern Plains severe thunderstorms wind risk map for July 2, 2026, showing a 30 percent damaging wind probability and significant severe area over the Dakotas and Minnesota

Northern Plains Severe Thunderstorms: Enhanced Risk Issued for July 2, 2026

Northern Plains severe thunderstorms are the top weather story on Thursday, July 2, 2026, as the NOAA Storm Prediction Center has placed portions of the northern Plains into the Upper Midwest under an Enhanced Risk, the…

Read More

Leave a Reply