Wondering what a quasi-stationary front is and why it causes catastrophic flooding, what QPF means in a weather forecast, or how the Quasi-Biennial Oscillation influences winter cold outbreaks? “Q” is a short letter in weather science, but the terms it covers, including quantitative precipitation forecasts, stationary front weather effects, heat index thresholds, and quality control of weather data, are essential to understanding how modern forecasting works and what your local NWS forecast really means.
Jump to weather terms beginning with the letter:
A | B | C | D | E | F | G | H | I | J | K | L | M | N | O | P | Q | R | S | T | U | V | W | X | Y | Z
Get Severe Weather Alerts for Your Location
When any NWS watch, warning, or advisory is issued for your area, iAlert sends you an immediate notification by email or text, 24 hours a day, 7 days a week.
Sign Up for Severe Weather Alerts →Weather Terms Beginning with “Q”
Quasi-Stationary Front
A quasi-stationary front is a weather front that is moving at less than 5 knots (about 6 mph) in either direction, essentially “stalled” between two competing air masses that are roughly in balance. On weather maps, it is represented as alternating blue triangles (cold front symbols) and red semicircles (warm front symbols) on opposite sides of the line. Unlike a cold front that passes in hours, a quasi-stationary front can park over a region for days, producing persistent rain, drizzle, fog, and overcast skies as weather systems track along rather than through it. The stall is often caused by a blocking high pressure system that prevents the normal west-to-east progression of fronts. Quasi-stationary fronts are strongly associated with prolonged, catastrophic flooding, the Great Mississippi River floods of 1993 and 2008 were both preceded by stationary fronts that focused heavy rainfall over the same watersheds for weeks, producing some of the most expensive flood disasters in US history.
Front Types Compared
| Type | Symbol | Movement | Precipitation | Duration | Season |
|---|---|---|---|---|---|
| Cold Front | Blue line with triangles pointing in direction of movement | 20-35 mph typical | Heavy rain/storms in a narrow band | Hours to pass | All seasons |
| Warm Front | Red line with semicircles pointing in direction of movement | 10-20 mph typical | Widespread stratiform rain, fog | 12-24 hours to pass | All seasons |
| Stationary / Quasi-stationary Front | Alternating blue triangles and red semicircles | Less than 5 knots | Persistent rain/drizzle for days | Days to weeks | All seasons |
| Occluded Front | Purple with alternating triangles and semicircles | Slows as storm matures | Widespread, diminishing precipitation | 12-24 hours to pass | Fall-Spring |
Quantitative Precipitation Forecast (QPF)
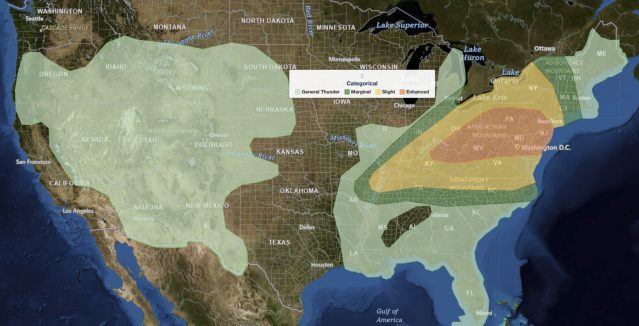
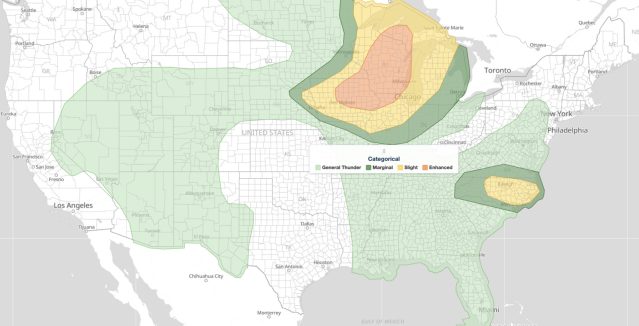
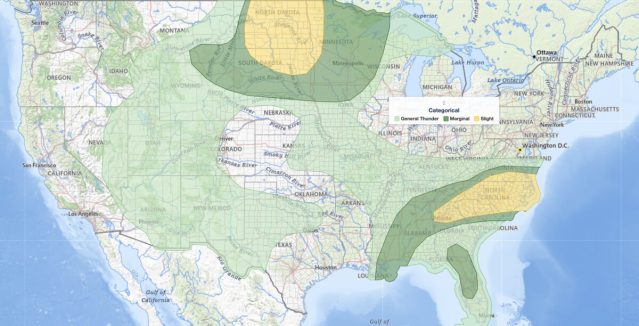
A Quantitative Precipitation Forecast is an official NWS forecast of the expected total precipitation, rain or snow water equivalent, in inches over a specified area and time period. QPF is issued in both graphical and text form for Day 1-3 by the NWS Weather Prediction Center (WPC) and extended through Day 7 in broader terms. QPF forecasts are the foundational input for river flood forecasting, drought monitoring, reservoir management, and water resource planning. Hydrologists at NWS River Forecast Centers feed QPF directly into river flood models to predict whether streams and rivers will reach or exceed flood stage. The accuracy of flash flood warnings depends heavily on how well QPF captures the location and intensity of extreme rainfall, a QPF that is off by even a few miles can mean the difference between a timely warning and a deadly flash flood with no warning. Modern dual-polarization Doppler radar has significantly improved real-time QPF estimates during ongoing precipitation events.
Q-Vectors
Q-vectors are a mathematical diagnostic tool used in atmospheric dynamics to identify regions of forced vertical motion, rising and sinking air, without the algebraic complications of the traditional quasi-geostrophic omega equation. Developed by Hoskins and Pedder in 1978, Q-vectors elegantly combine the effects of temperature advection and wind deformation into a single diagnostic. Convergence of Q-vectors (Q-vectors pointing toward each other) identifies regions of upper-level forcing for rising motion, which is favorable for precipitation and storm development. Divergence of Q-vectors identifies regions of subsidence (sinking air) and suppressed precipitation. Q-vectors are widely used by both research and operational meteorologists to diagnose where heavy precipitation and rapid cyclogenesis are likely to occur, and are available on standard upper-level analysis charts used by NWS forecasters every day.
Quasi-Biennial Oscillation (QBO)
The Quasi-Biennial Oscillation is a quasi-periodic reversal of equatorial stratospheric winds occurring at approximately 28-month intervals. The winds at altitudes of roughly 60,000-100,000 feet over the equator alternate between easterly (from the east) and westerly (from the west) phases in a cycle that averages about 28 months but varies from roughly 22 to 34 months. Despite occurring high in the stratosphere, the QBO influences surface weather through teleconnections: the QBO westerly phase is associated with a stronger, more organized polar vortex, fewer sudden stratospheric warming events, and less frequent Arctic cold outbreaks into the US and Europe. The QBO easterly phase is associated with a weaker, more disrupted polar vortex, more frequent sudden stratospheric warming events, and a higher probability of the polar vortex sending lobes of cold Arctic air southward into populated mid-latitude regions. The QBO also subtly influences Atlantic hurricane season activity, its westerly phase is loosely associated with somewhat reduced hurricane activity due to increased wind shear over the tropical Atlantic.
Quality Control (Weather Data)
Quality control is the process of automatically and manually checking weather observations for errors before they enter computer models, climate databases, and warning systems. Automated QC algorithms flag observations that deviate significantly from neighboring stations, from climatological norms for that location and time of year, or from physical possibility, for example, a temperature reading of 200 degrees F or a wind speed of 500 mph. Erroneous data entering NWP models can corrupt the model’s initial state and degrade forecast quality for a wide region downwind. The NWS operates sophisticated automated quality control systems for its ASOS (Automated Surface Observing System) network and its radiosonde (weather balloon) observations. Human forecasters perform additional manual quality control during significant weather events when accurate data is particularly critical. CoCoRaHS and cooperative observer data also undergo automated and human review before entering national archives.
Quick-Onset Flooding
Quick-onset flooding is a type of flash flooding that develops within minutes to 1-2 hours of heavy rainfall, particularly in urban areas or steep terrain with little or no vegetation. Concrete, asphalt, and other impervious surfaces in cities dramatically accelerate runoff compared to natural soil, a 2-inch rainfall in 1 hour on an urban watershed with 70% impervious cover can produce flooding within 30 minutes of onset. Municipal storm drain systems are typically designed to handle a 10-year storm (a storm with a 10% annual probability of occurrence) and will overflow in more extreme events. Small streams and drainage ditches in steep terrain also respond within minutes to intense rainfall. The NWS issues Urban and Small Stream Flood Advisories and Flash Flood Warnings for these quick-response watersheds. The danger of quick-onset flooding is that it leaves little time for warning dissemination and response, it is one of the leading causes of weather-related deaths in the US, with a majority of fatalities involving vehicles attempting to cross flooded roads.
Heat Index (Apparent Temperature)
The Heat Index, sometimes called apparent temperature or “feels like” temperature, is a measure that combines air temperature and relative humidity to estimate the equivalent temperature a human body perceives. High humidity inhibits the evaporation of sweat, which is the body’s primary cooling mechanism, causing the body to retain more heat than the thermometer reading alone would suggest. The NWS Heat Index chart shows apparent temperatures that can exceed the air temperature by 10-20 degrees F when both heat and humidity are extreme. A Heat Advisory is issued when the heat index is expected to reach 100-104 degrees F for 2 or more hours. An Excessive Heat Warning is issued when the heat index is expected to reach 105 degrees F or higher, posing serious health risks including heat cramps, heat exhaustion, and heat stroke. An Excessive Heat Watch is issued 24-72 hours in advance to give residents time to prepare. Heat is consistently the leading cause of weather-related deaths in the United States, killing more people each year than tornadoes, hurricanes, or floods on average.
Severe Weather Alerts, Any Location, Any Time
From a Flash Flood Warning to an Excessive Heat Warning, iAlert monitors every NWS alert and notifies you the moment one is issued for your area. Set up alerts for home, work, school, or anywhere your family is.
Get Weather Alerts →Frequently Asked Questions, “Q” Weather Terms
What is a quasi-stationary front?
A quasi-stationary front is a weather front that is essentially stalled, moving at less than 5 knots in either direction. It sits between two competing air masses that are roughly in balance. Instead of moving through quickly like a cold front, a stationary front parks over a region and can produce days of persistent clouds, rain, drizzle, and fog as weather systems track along it from west to east. This is why some of the most catastrophic flooding events in US history occurred, including the 1993 Great Mississippi River floods, when stationary fronts focused heavy rainfall over the same region for weeks.
What is a QPF in weather forecasting?
QPF stands for Quantitative Precipitation Forecast, an official NWS prediction of how much rain or snow (in water-equivalent inches) will fall over a given area during a specific time period. The NWS Weather Prediction Center issues QPF maps covering Days 1-3. These forecasts are critical inputs for river flood modeling at NWS River Forecast Centers, which use QPF to predict whether rivers will rise to flood stage. They are also essential for water utilities, agriculture, dam operators, and emergency managers preparing for potential flooding events.
What is the Quasi-Biennial Oscillation and how does it affect weather?
The Quasi-Biennial Oscillation (QBO) is a roughly 28-month cycle of alternating easterly and westerly winds in the equatorial stratosphere. Though it occurs at altitudes of 60,000-100,000 feet, it influences surface weather by affecting the strength and organization of the polar vortex. During the QBO westerly phase, the polar vortex tends to be stronger and more stable, keeping Arctic air locked in the north. During the QBO easterly phase, the polar vortex is weaker and more prone to disruption, increasing the chance of cold air outbreaks in the US and Europe. It also subtly influences Atlantic hurricane activity.
Why is front stalling dangerous for flooding?
When a front stalls as a quasi-stationary front, weather systems no longer push through and move on, instead, they track along the front from west to east, bringing waves of heavy rainfall to the same geographic corridor repeatedly. Each storm wave may produce 1-3 inches of rain; after 3-5 such waves over 5-10 days, total rainfall can reach 10-20 inches, overwhelming river systems and causing catastrophic flooding. The 1993 Great Mississippi River floods, which caused $15 billion in damage, were driven largely by a quasi-stationary front that focused wave after wave of heavy rainfall over the Missouri and Mississippi River watersheds for weeks.
What does quality control mean in weather data?
Quality control (QC) in weather data means checking observations from automated and manual stations for errors before those observations enter weather forecast models, climate databases, and warning systems. Automated QC algorithms flag data that seems wrong, for example, a temperature spike of 50 degrees in an hour, or a wind speed reading of 500 mph. Human forecasters also perform manual QC, especially during significant weather events when accurate data is critical. Bad data that passes QC can corrupt computer model analyses and degrade forecast accuracy for the entire region downwind.
What is an Excessive Heat Warning vs a Heat Advisory?
Both are NWS products issued when dangerously hot conditions are expected, but they differ in severity. A Heat Advisory is issued when the heat index (the “feels like” temperature combining air temperature and humidity) is expected to reach 100-104 degrees F for 2 or more hours. An Excessive Heat Warning is issued when the heat index is expected to reach 105 degrees F or higher, posing serious health risks including heat exhaustion and heat stroke. An Excessive Heat Watch is issued 24-72 hours before either threshold is expected, giving residents time to prepare. Heat is the leading cause of weather-related deaths in the US.
Never Miss a Severe Weather Alert
iAlert monitors National Weather Service watches, warnings, and advisories around the clock and sends you an immediate notification the moment your area is threatened. Works for any U.S. location.
View All Alert Services → Severe Weather Alerts →Related Articles
- Get real-time Severe Weather Email & Text Alerts
- Drought Defined
- What is the Difference Between a Flash Flood and a Flood?
- Flood Safety
- Criteria for a Flood Warning and Flash Flood Warning
- Hot Weather Survival Tips, Excessive Heat
- Heat Index Calculator
- Understanding the NWS Severe Weather Outlook
- Criteria for a Severe Thunderstorm Warning
- WxData.com, Weather Data API for apps and systems