Wondering about the difference between an ice storm warning and a winter storm warning? Or what a temperature inversion does to your local weather, what ice pellets actually are, or how to read isobars on a weather map?
Jump to weather terms beginning with the letter:
A | B | C | D | E | F | G | H | I | J | K | L | M | N | O | P | Q | R | S | T | U | V | W | X | Y | Z
Get Severe Weather Alerts for Your Location
When any NWS watch, warning, or advisory is issued for your area, iAlert sends you an immediate notification by email or text, 24 hours a day, 7 days a week.
Sign Up for Severe Weather Alerts →Weather Terms Beginning with “I”
Ice Fog
Ice fog is a type of fog that occurs when air temperatures are well below freezing, typically -20°F or colder, and tiny ice crystals suspended in the air reduce visibility to 5/8 mile or less. Unlike ordinary fog formed by liquid water droplets, ice fog consists entirely of microscopic ice crystals that glitter in sunlight and deposit rime ice on surfaces, vegetation, power lines, and aircraft. Ice fog is most common in Arctic regions, Alaska, and the inland Northwest during winter inversions, where cold air pools in valleys and basins for days at a time. It creates extremely hazardous driving conditions because road surfaces accumulate rime ice that is nearly invisible and the ice crystals themselves scatter light in ways that make judging distances difficult. Ice fog can persist for several days during cold air damming events, when cold air is held in place by mountains and high pressure, with no mechanism to break it up until temperatures finally rise above freezing.
Ice Jam Flood
An ice jam flood occurs when a river’s ice cover breaks up in late winter or early spring and ice chunks pile up at natural or manmade constrictions, narrow channels, bridge abutments, shallow riffles, forming a dam that rapidly raises water levels upstream. Unlike rain-driven flooding that builds over hours or days, ice jam floods can produce water level rises of 10 to 20 feet in just a few hours with almost no warning, even with no rain falling at all. The moving ice itself causes additional structural damage, destroying riverbank buildings, dock structures, and bridge supports through sheer force. The NWS issues Ice Jam Flood Warnings when these events occur. Ice jam flooding is most common along rivers in the Northeast, the northern Great Plains, and Alaska during the spring breakup period. The combination of speed, unpredictability, and the physical force of moving ice makes ice jam floods potentially more destructive than rainfall-driven events of the same water level.
Ice Pellets (Sleet)
Ice pellets, commonly called sleet in public weather forecasts, are a form of winter precipitation consisting of transparent or translucent pellets of ice 5 millimeters or less in diameter. They form when raindrops or partially melted snowflakes fall through a subfreezing layer of air near the surface (typically 1,000 to 3,000 feet deep) and freeze completely before reaching the ground. The key characteristic is that ice pellets freeze while still airborne and bounce visibly when they strike hard surfaces, pavement, car hoods, windows, producing a characteristic clicking sound. This distinguishes them from freezing rain, which reaches the surface as a liquid and freezes on contact. Ice pellets can accumulate like snow and create dangerously slippery conditions on road surfaces. The NWS uses the term “sleet” in public forecast products because it is more widely understood, but the official meteorological term recognized internationally is “ice pellets.”
Ice Storm
An ice storm is a weather event in which freezing rain falls and accumulates ice on exposed surfaces to a depth of 1/4 inch or more. Significant ice storms produce 1/2 inch or more of glaze ice, downing trees and power lines across widespread areas and making roads and sidewalks impassable. Power outages from major ice storms can affect millions of customers for days to weeks, far longer than outages caused by most other weather events, because repairing ice-damaged infrastructure is slow work that cannot begin until the ice melts. A 1/2-inch accumulation of ice adds roughly 500 pounds of weight to a single tree branch, and the compounding weight across an entire forest canopy snaps branches and topples trees onto power lines on a massive scale. Ice storms are most common in the Carolinas, Georgia, Tennessee, Arkansas, and the southern Plains, where warm moist air from the Gulf frequently overrides shallow arctic air at the surface. The December 2013 ice storm across the South and Mid-Atlantic was one of the most damaging in recent US history.
Ice Storm Warning
An Ice Storm Warning is issued by the NWS when significant ice accumulation from freezing rain of 1/4 inch or more is expected on surfaces. It represents the most dangerous type of winter precipitation event because even modest ice accumulation makes roads and walkways extremely hazardous, brings down trees and power lines, and can strand entire communities without electricity, heat, or passable roads for days. Recipients should avoid all unnecessary travel, stock emergency supplies (including heat sources that do not require electricity), and be prepared for extended multi-day power outages. Tree limbs and power lines begin to fail at 1/4 inch of ice accumulation; 1/2 inch of ice adds about 500 pounds of weight to a typical tree branch. Ice Storm Warnings are not issued for every winter storm, they are specifically reserved for events where freezing rain is the dominant hazard. See also: Winter Storm Watch vs. Warning vs. Advisory.
| Winter Weather Advisory | Winter Storm Warning | Ice Storm Warning | |
|---|---|---|---|
| Primary Threat | Mixed winter precip or light snow | Heavy snow, blizzard conditions | Freezing rain accumulation |
| Snow Threshold | 1-3 inches | 6+ inches (varies by region) | N/A (rain-based) |
| Ice Threshold | 0.1-0.25 inch | 0.25+ inches (mixed) | 0.25+ inches of glaze ice |
| Wind | Not primary threat | May include high winds | Not primary threat |
| Urgency | Use caution | Significant threat to life/property | Dangerous, avoid travel |
| Power Outage Risk | Low | Moderate (heavy wet snow) | Very high |
Temperature Inversion
A temperature inversion is a layer of the atmosphere in which temperature increases with altitude, the opposite of the normal pattern where the air gets colder as you go higher. This inversion layer acts as a lid on the atmosphere, preventing vertical mixing and trapping cold air, pollutants, smoke, and fog at the surface beneath it. Surface-based inversions form overnight through radiational cooling, the ground loses heat rapidly after sunset, chilling the air just above it, and typically break up by mid-morning as solar heating warms the surface again. Elevated inversions, sometimes called capping inversions, can suppress thunderstorm development by preventing rising parcels of warm, moist surface air from breaking through; when afternoon heating finally erodes the cap, the release can trigger explosive, violent thunderstorm development. Persistent inversions in mountain valleys, especially in the intermountain West, can trap air pollution at dangerous levels for days at a time. Inversions also channel sound waves along the surface, which is why thunder from distant storms or industrial explosions can be heard at unusually long distances during inversion conditions.
Isobar
An isobar is a line on a weather map connecting all points of equal atmospheric pressure at a given time. Isobars are the primary tool meteorologists use to depict the surface pressure pattern, identify areas of high and low pressure, and estimate wind speed and direction. The spacing between isobars reveals the pressure gradient: closely spaced isobars indicate a steep pressure gradient and strong winds, because air accelerates rapidly from high pressure toward low pressure across a short distance. Widely spaced isobars indicate a gentle pressure gradient, light winds, and more settled conditions. Isobars are typically drawn at 4-millibar intervals on surface weather analysis charts. Closed isobar patterns define cyclones (low pressure centers, associated with storms) and anticyclones (high pressure centers, associated with fair weather). A tight cluster of isobars around a low pressure center is a reliable indicator of an intense storm system.
Isotherm
An isotherm is a line on a weather map connecting all points of equal temperature at a given time. Isotherms are used to identify warm and cold air masses, locate frontal boundaries, and visualize temperature gradients across a region. On a surface analysis map, the 32°F (0°C) isotherm is particularly critical because it separates areas where precipitation will fall as rain from areas where it will fall as snow or freezing rain, forecasters track it closely during winter storm events to determine the rain-snow boundary. At upper levels, isotherms reveal the position and structure of the jet stream, identify air mass boundaries aloft, and help meteorologists assess the potential for severe weather. Temperature gradient analysis using isotherms is central to identifying and tracking frontal systems.
Indian Summer
Indian Summer describes a period of unseasonably warm, dry, and calm weather that occurs in late autumn after the first killing frost, typically in late October or November in the northern US. The pattern develops when an anticyclone (high pressure system) settles over the region, bringing clear skies, light winds, and temperatures significantly above normal for the season, sometimes 15 to 20°F above the climatological average. The air often has a hazy, golden quality from atmospheric dust, distant fires, and residual humidity that scatters sunlight. Indian Summer has no official meteorological definition, the NWS does not issue Indian Summer forecasts, and the term is largely folkloric and regional, with usage varying considerably across different parts of the country. The term may derive from the warm season that gave Native American tribes an additional period to gather food before winter.
Icing (Aviation)
Aviation icing refers to the accumulation of ice on aircraft surfaces, wings, propellers, engine inlets, and control surfaces, during flight through supercooled liquid water droplets (cloud droplets or rain that remains liquid below 32°F). Ice changes the aerodynamic shape of lifting surfaces, dramatically reducing lift and increasing drag; even a thin layer of ice with the texture of coarse sandpaper can reduce lift by 30% and increase drag by 40%. Severe icing can completely alter a wing’s profile in minutes, leading to loss of control. In-flight icing is a significant contributing factor in general aviation accidents. The NWS issues AIRMETs (Airmen’s Meteorological Information) for light-to-moderate icing and SIGMETs for severe icing conditions. Most commercial transport aircraft are equipped with de-icing and anti-icing systems; many general aviation aircraft are not, making icing encounters potentially fatal for those pilots.
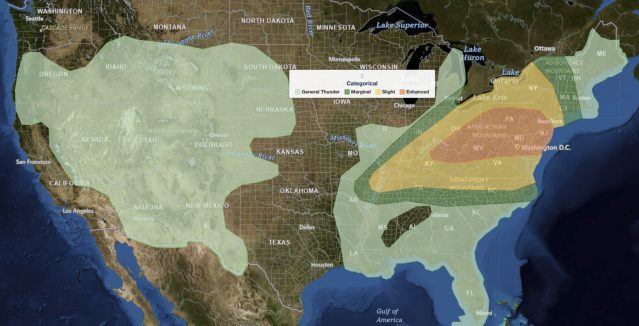
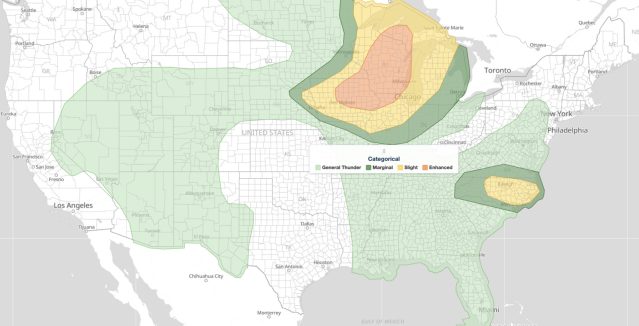
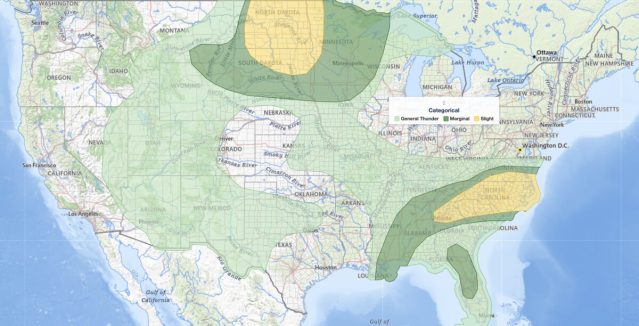
Atmospheric Instability
Atmospheric instability is a condition in which a parcel of air that is forced upward remains warmer, and therefore less dense, than the surrounding environment and continues to accelerate upward under its own buoyancy. When the atmosphere is sufficiently unstable, towering thunderstorms can develop rapidly. Instability increases with surface heating, cold air moving in aloft, or abundant low-level moisture. Meteorologists use several tools to quantify instability: Convective Available Potential Energy (CAPE) measures the total buoyant energy available to a rising air parcel in joules per kilogram, values above 1,000 J/kg indicate thunderstorm potential, values above 2,500 J/kg indicate extreme instability capable of producing violent tornadoes, and values on significant tornado days in the southern Plains can exceed 4,000-5,000 J/kg. The Lifted Index (LI) offers a complementary measure, values below -6 indicate extreme instability. Both values are derived from radiosonde (weather balloon) data and are critical inputs for daily severe weather forecasts.
Severe Weather Alerts, Any Location, Any Time
From an Advisory to a Warning, iAlert monitors every NWS alert and notifies you the moment one is issued for your area. Set up alerts for home, work, school, or anywhere your family is.
Get Weather Alerts →Frequently Asked Questions, “I” Weather Terms
What is an Ice Storm Warning and how is it different from a Winter Storm Warning?
An Ice Storm Warning is issued when freezing rain is expected to produce ice accumulations of 1/4 inch or more on surfaces. This is extremely dangerous because ice coats roads, sidewalks, and steps with a nearly invisible glaze, causes trees and power lines to collapse under the weight, and can produce widespread multi-day power outages. A Winter Storm Warning is broader and can be issued for heavy snow, blizzard conditions, or a combination of hazards. An Ice Storm Warning represents the most dangerous winter precipitation type because even 1/4 inch of ice accumulation can make travel impossible and knock out power for millions of customers simultaneously.
What is the difference between ice pellets (sleet) and freezing rain?
Both fall from winter storms with a near-surface layer of subfreezing air, but the freezing happens at different points in the descent. Sleet (ice pellets) falls through enough subfreezing air to freeze completely while still airborne, arriving at the ground as small, hard, transparent pellets that bounce on contact. Freezing rain falls through only a very shallow layer of cold air near the surface, not enough to freeze in the air, and instead freezes on contact with surfaces below 32°F, forming smooth, transparent glaze ice. Freezing rain is more dangerous than sleet because the resulting ice surface is not always visible on road pavement, and because glaze ice coats every exposed surface uniformly, making even walking extremely hazardous.
What is a temperature inversion and how does it affect weather?
A temperature inversion is a layer of the atmosphere where temperature increases with altitude instead of decreasing, as it normally does. This stabilizes the atmosphere and prevents vertical mixing. Surface-based inversions trap fog, pollution, and smoke near the ground, sometimes for days at a time in valley locations. Elevated inversions create a capping layer that suppresses thunderstorm development; forecasters watch carefully for when afternoon surface heating will finally erode the cap and release the energy stored beneath it, which can trigger explosive and violent thunderstorm development. Inversions are also responsible for channeling sound waves so that thunder or industrial sounds are heard at unusually long distances from the source.
What is an ice jam flood?
An ice jam flood occurs when a river’s ice cover breaks up in late winter or spring and ice chunks pile up at a narrow river section, forming a dam that rapidly raises water levels upstream. Unlike rain-driven flooding, ice jam floods can raise water levels 10 to 20 feet in just a few hours with almost no warning and with no rain falling whatsoever. The moving ice itself causes additional damage to bridges, riverbank structures, and anything in the floodplain. Ice jam floods are most common in the Northeast, the Great Plains, and Alaska during the spring breakup season. The NWS issues Ice Jam Flood Warnings when these events occur, but the rapid onset means there is often very little time to act.
What is an isobar on a weather map?
An isobar is a line on a surface weather map that connects all points of equal atmospheric pressure, drawn at regular intervals, usually every 4 millibars. Isobars help meteorologists identify high and low pressure centers, the strength of pressure gradients, and expected wind patterns. Closely packed isobars indicate a steep pressure gradient, the greater the pressure difference across a short distance, the stronger the resulting wind. Loosely spaced isobars indicate light winds and more settled conditions. The closed, roughly circular isobars surrounding a low pressure center mark the core of a cyclone; the tighter the isobars, the more intense the storm.
What is CAPE and why do storm chasers talk about it?
CAPE stands for Convective Available Potential Energy, a measure of atmospheric instability that quantifies how much energy is available to power thunderstorm updrafts. It is measured in joules per kilogram (J/kg). Values under 1,000 J/kg indicate weak instability with ordinary thunderstorm potential. Values of 1,000-2,500 J/kg suggest moderate instability with severe thunderstorm potential. Values above 2,500 J/kg indicate extreme instability capable of producing violent, long-track supercell tornadoes. On the most significant tornado days in Tornado Alley, CAPE values can exceed 4,000-5,000 J/kg. Storm chasers and forecasters monitor CAPE values and maps daily during severe weather season because high CAPE directly correlates with the intensity of storm updrafts and tornado potential.
Never Miss a Severe Weather Alert
iAlert monitors National Weather Service watches, warnings, and advisories around the clock and sends you an immediate notification the moment your area is threatened. Works for any U.S. location.
View All Alert Services → Severe Weather Alerts →Related Articles
- Get real-time Severe Weather Email & Text Alerts
- Winter Storm Watch vs. Warning vs. Advisory
- Winter Storms, A Preparedness Guide
- OSHA Safe Winter Driving Tips
- OSHA: Protecting Workers from Cold Temperature Stress
- What is Hypothermia?
- What is Frostbite?
- How is Wind Chill Calculated?
- Criteria for a Tornado Warning
- Criteria for a Severe Thunderstorm Warning
- Understanding the NWS Severe Weather Outlook
- WxData.com, Weather Data API for apps and systems