Each year, iAlert publishes an annual severe weather report covering storm activity across the United States. The reports draw from iAlert’s national storm report database, including spotter reports, sensor data, and official severe weather records from sources including the National Weather Service, to produce a detailed year-end summary of tornadoes, hail, wind events, flooding, and winter weather. The archive now spans seven consecutive years, and a new report is added every January.
This page is the home for that growing archive. Every report is available to read online in full, with interactive charts, and as a downloadable PDF. Whether you’re tracking a specific event type, comparing activity across years, or looking for regional storm data, the reports are built to support that kind of reference use.
Seven Years of Annual Severe Weather Reports
The archive currently covers 2019 through 2025, seven consecutive years of documented U.S. severe weather activity. That span is long enough to show patterns that a single year cannot reveal. High-activity years like 2019, 2022, and 2025 stand out against quieter years like 2024. Winter weather consistently dominates report counts nationally, but tornado and wind activity shift considerably from year to year depending on seasonal patterns and atmospheric conditions.
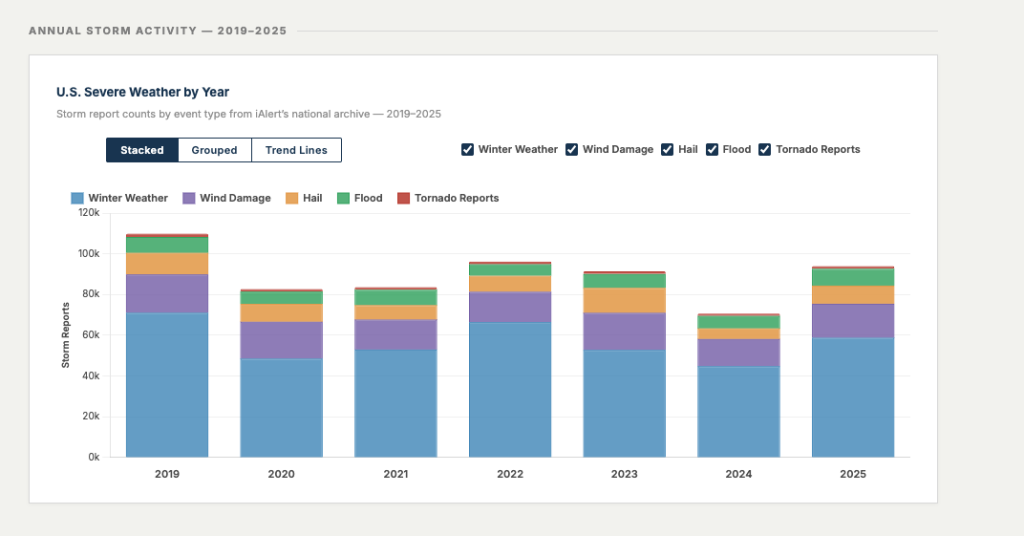
The chart above is one of the interactive views available on the reports page. It shows storm activity broken down by event type across all seven years. You can toggle between stacked, grouped, and trend line views to explore how each category has shifted. 2025 came in 34% above 2024 in total storm reports, driven largely by a surge in winter weather and wind activity in the first half of the year.
What Each Annual Severe Weather Report Contains
Every report in the archive follows a consistent structure so data is easy to compare across years. Each annual severe weather report covers total storm report counts broken down by event type, tornado activity by state and month, hail reports with significant event thresholds, wind events from both thunderstorm and non-thunderstorm sources, flooding by type including flash flood and coastal flood, winter weather breakdowns by snow, sleet, freezing rain, and blizzard, and the full volume of NWS alerts issued for the year. Geographic distribution tables show which states drove the most activity.
The online version of each report includes interactive charts that let you filter and explore the data. The PDF version provides a clean, printable summary. Both are available for every year in the archive going back to 2019.
A Resource That Grows Every Year
A single annual severe weather report tells you what happened in a given year. Seven years of reports together start to show what is typical, what is unusual, and where long-term activity is trending. That cumulative context is the value of an archive over a one-time publication. As the dataset grows, the year-over-year comparisons become more informative and the historical baseline more reliable.
In addition to the completed annual reports, the page tracks current-year monthly storm report counts and NWS alert volumes as the year progresses. That means you can follow 2026 data in near real time alongside the full historical record from prior years.
The next full annual report covering 2026 will be added in January 2027. Storm data for the current year is compiled continuously and reviewed before the final report is published.
Explore the Full Archive
Seven years of U.S. severe weather reports, online and PDF. Updated annually.
View Reports and Metrics