How 30 Years of NOAA R&D Made a Tsunami Forecast Land Exactly When It Mattered
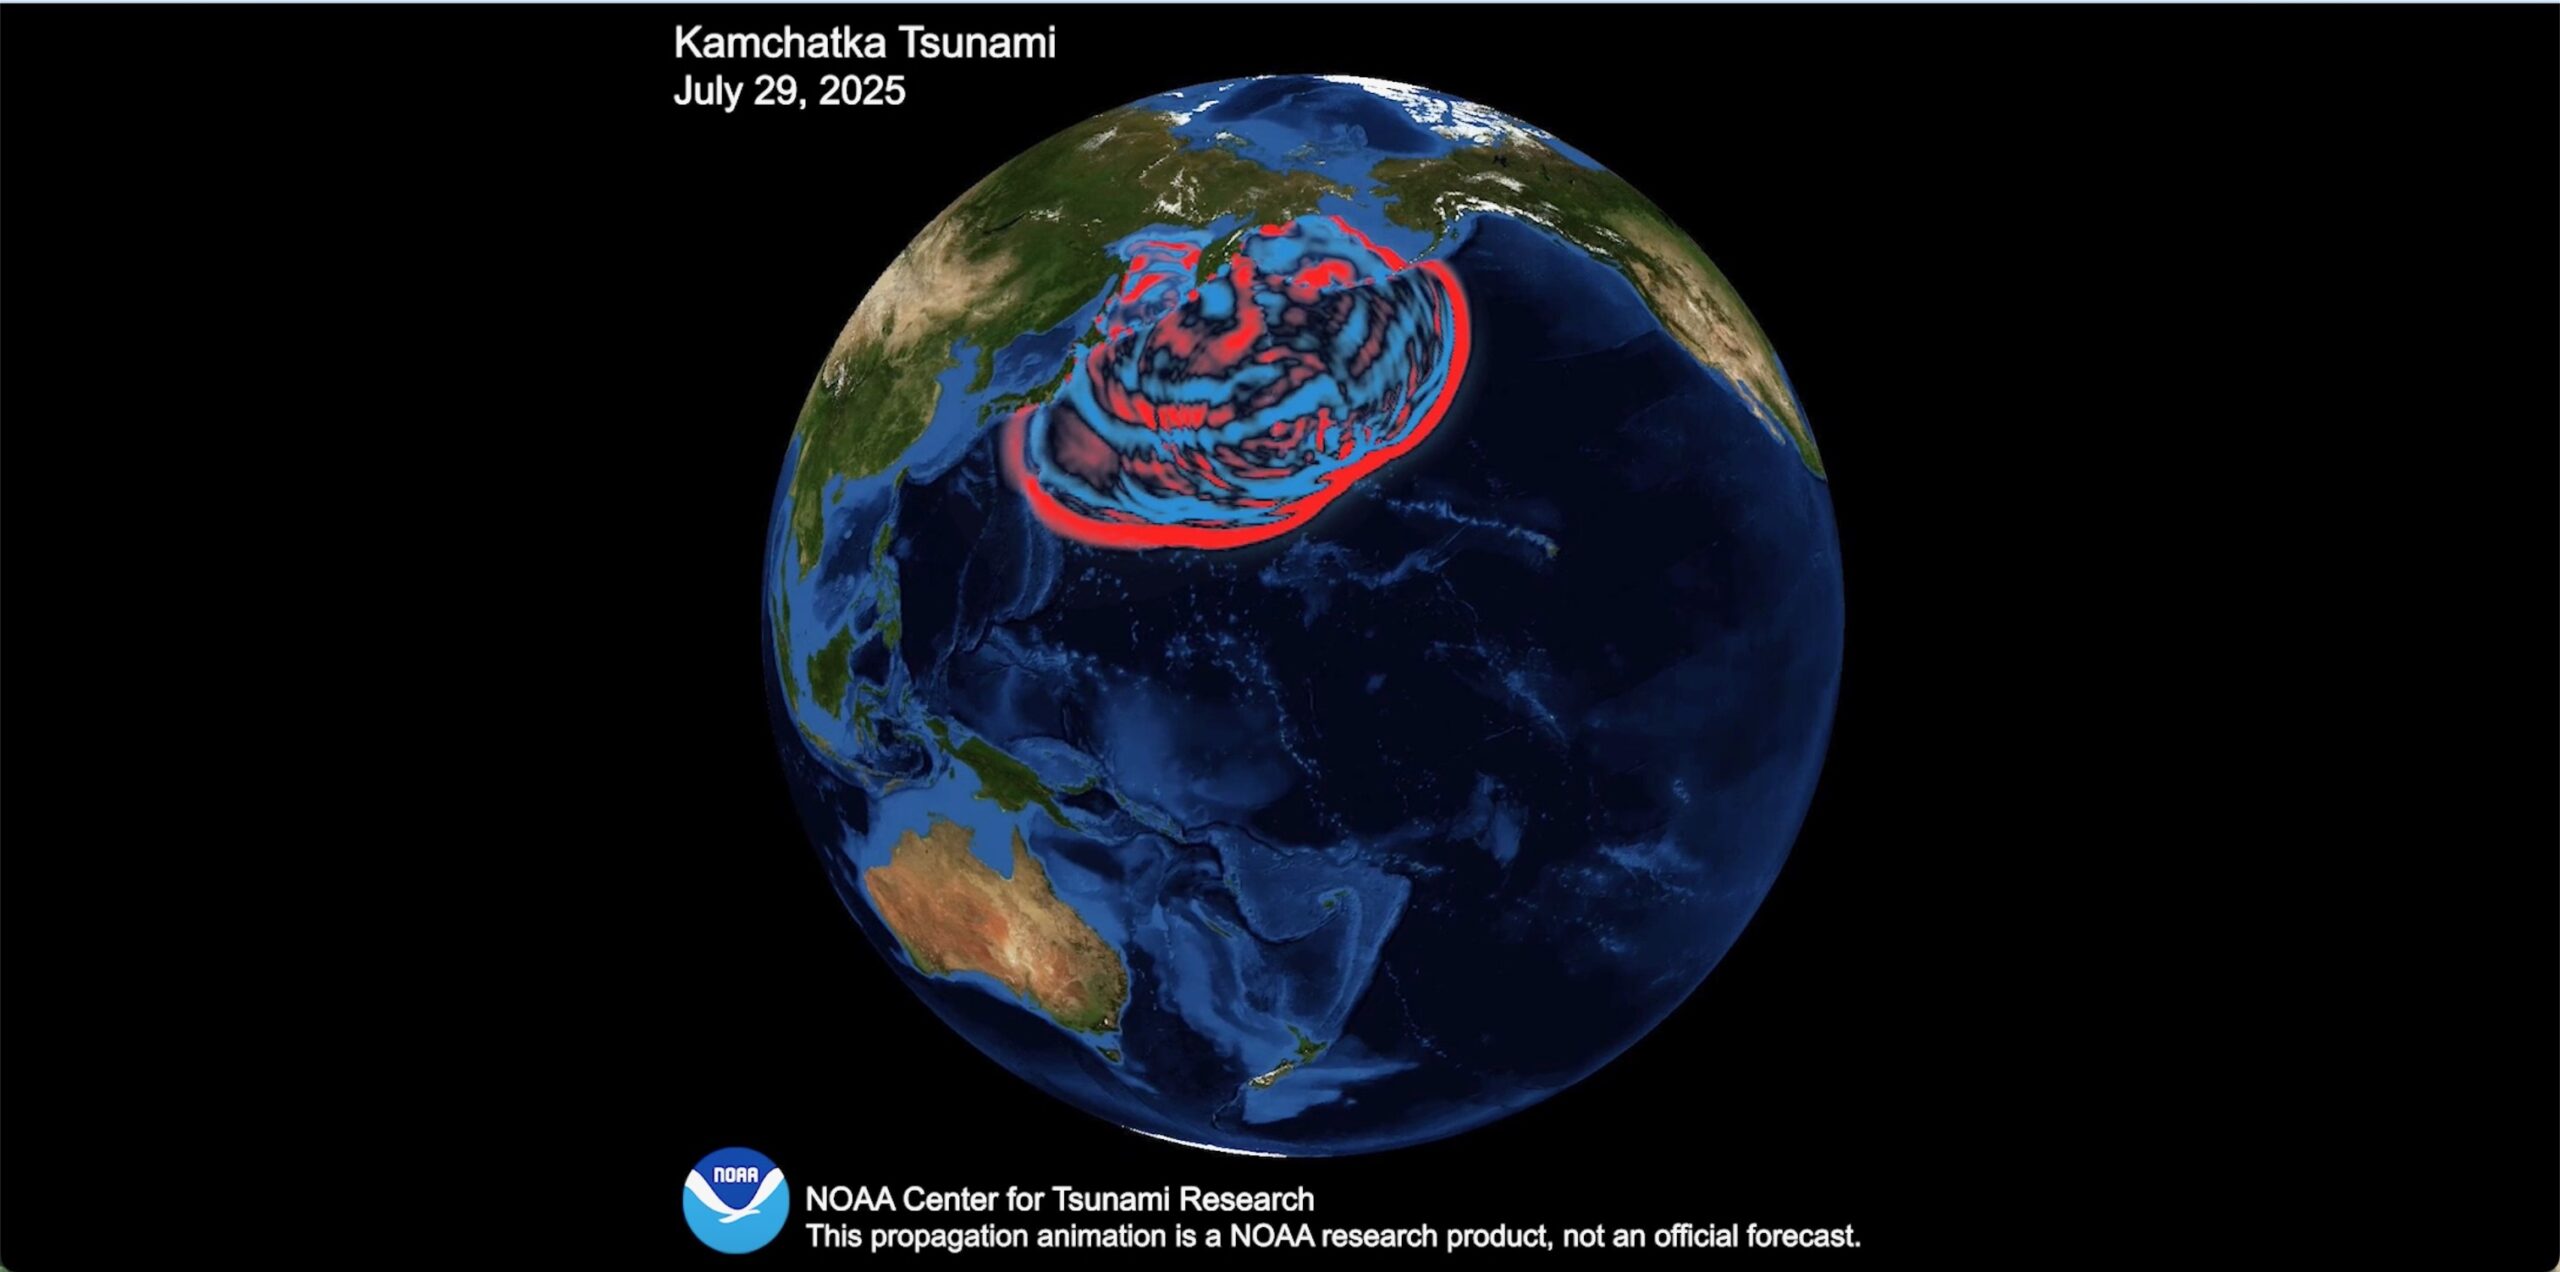
Event in brief. In late July 2025, a magnitude 8.8 megathrust earthquake off Russia’s Kamchatka Peninsula triggered Pacific-wide tsunami alerts. NOAA’s forecast, including timing, heights, and currents, proved unusually accurate and was updated in real time as new ocean data arrived.What made the forecast so good?
→ A purpose-built observing network. NOAA’s Deep-ocean Assessment and Reporting of Tsunamis (DART) stations detect tiny pressure changes from passing waves and transmit the data to warning centers within minutes. After the 2004 Indian Ocean disaster, the United States deployed a roughly 39-station array that now underpins Pacific forecasts. → Physics-based modeling (MOST). The Method of Splitting Tsunamis model simulates generation, basin-scale propagation, and detailed coastal flooding when supplied with bathymetry, topography, and a candidate earthquake source. It is the engine behind inundation maps used for planning and drills. → Real-time data assimilation (SIFT). Short-term Inundation Forecasting for Tsunamis blends live DART measurements with a library of precomputed scenarios to rapidly infer the actual source and produce site-specific arrival times, amplitudes, currents, and inundation. Then it refreshes those outputs as additional observations stream in.How it played out
→ Initial solution from seismic data provided a fast, first-order forecast. → DART constraints arrived as the waves crossed the basin, allowing SIFT to refine the source and reduce uncertainty. → Operational products, including updated ETAs, expected wave heights, and current guidance, supported targeted evacuations and port decisions from Alaska and Hawai‘i to the U.S. West Coast and beyond. → Independent reporting captured the hazard picture: warnings and evacuations across the Pacific, with observed waves generally below catastrophic thresholds, for example around 2 meters in parts of Hawaii and around 1 meter along segments of California.Why this is the culmination of 30 years
→ From prototype to operations. NOAA and PMEL advanced from early tsunameters in the 1990s to an operational, basin-scale DART network and real-time, assimilation-based forecasting by the late 2000s. This work demonstrably improves arrival-time and height accuracy compared with seismic-only methods. → Inundation mapping capacity. Hundreds of high-resolution coastal models now exist for U.S. communities, feeding emergency planning and live forecasts. → New cross-checks. Satellites can now detect tsunami signatures. 2025 SWOT observations are being used to validate and tune NOAA’s models.Takeaways
→ Forecast skill today rests on measurements plus models, not either alone. → Expect iterative updates during an event. Later advisories are usually better because they are constrained by real data. → Local readiness, including pre-mapped zones, evacuation routes, and TsunamiReady programs, is the difference between orderly moves to high ground and chaos.Read more at https://research.noaa.gov/how-30-years-of-noaa-research-led-to-one-very-accurate-and-timely-tsunami-forecast/