iAlert’s new web interface brings its weather analysis tools into one faster, cleaner place: live radar, satellite imagery, model data, hurricane tracking, storm reports, and much more. Whether you are on a desktop or your phone, the redesign makes it quicker to check conditions, study a developing system, and stay ahead of the weather that affects you. One more thing: our lightning detection alerts are live, just in time for a busy summer storm season.
This update touches the full set of weather analysis tools below. Here is what is new, what each tool does, and a link to explore each weather analysis tool yourself.
Key points:
- Redesigned web interface, rebuilt for desktop and mobile.
- Live weather radar with a national mosaic and local-level zoom, plus lightning, NWS alert, SPC outlook, and warning-polygon overlays.
- Animated satellite imagery in GeoColor, infrared, and visible.
- Side-by-side model analysis from GFS, HRRR, ECMWF, and IFS.
- Hurricane tracker with the live NHC forecast cone and map layers.
- Nationwide storm reports, filterable by event type, state, and date.
- One-click video export from radar, satellite, and the hurricane tracker, ready for social media and broadcast.
Jump to a weather analysis tool:
National Weather Radar
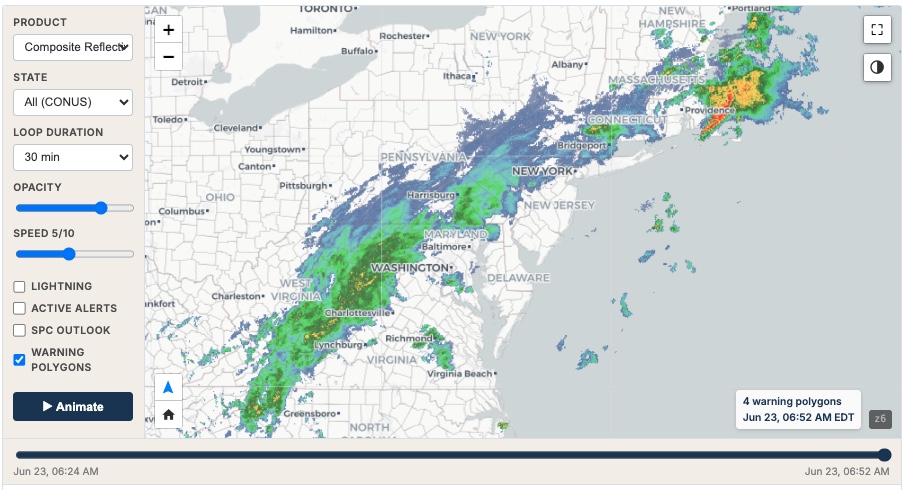
The radar view shows live weather radar data as a national mosaic, with local-level zoom for a closer look at your area. An animated loop plays the most recent frames, so you can watch where storms are moving and how intensity is changing in near real time.
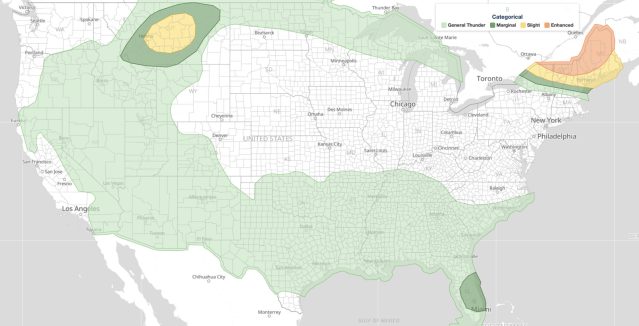
Switch between base reflectivity and composite reflectivity, both quality-controlled, set the loop to 1 or 2 hours, adjust opacity and playback speed, and read intensity off a dBZ scale. Layer on lightning strikes, active NWS alerts, the SPC severe outlook, and warning polygons to see the full threat in context.
You can also export the radar loop as a downloadable video, sized for social media or broadcast. Free accounts can test it; premium members get the full, clean export.
Satellite Imagery
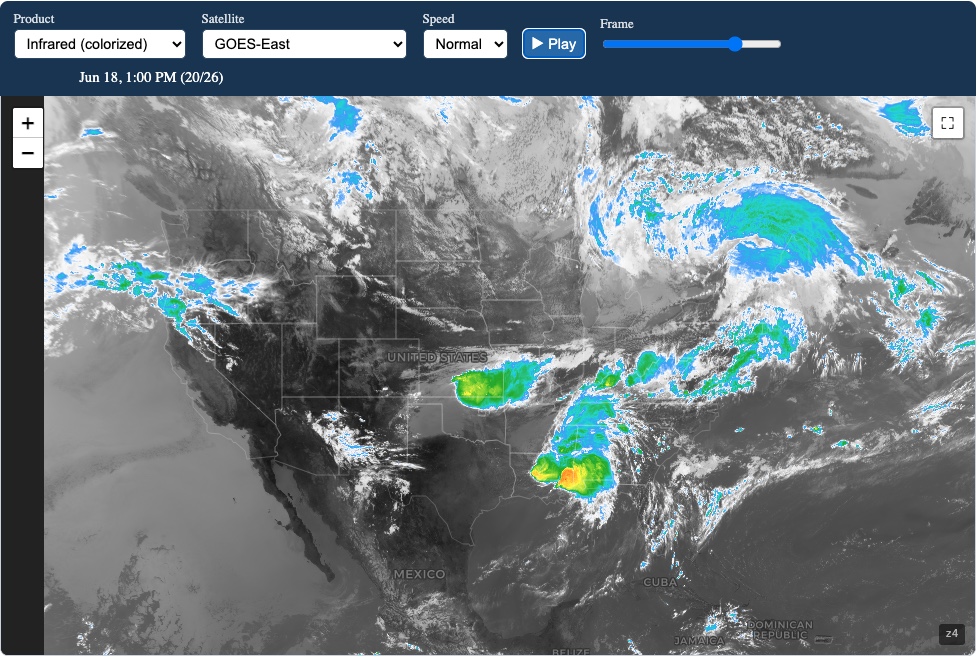
The satellite tool gives you animated views from GOES-East and GOES-West in three products: GeoColor (true color by day, infrared at night), colorized infrared, and 1 km visible. Zoom out to the full hemisphere, or loop the most recent hours to watch clouds and storm systems develop.
Imagery comes from the GOES-R ABI instruments via NOAA, with detail down to 0.5 km on the high-definition Atlantic view. Set the loop to slow, normal, or fast, pause on any frame, and step through the sequence one image at a time.
The same video export is here too: turn any satellite loop into a shareable clip for social media or broadcast. Free accounts can try it; premium members unlock the full export.
Model Analysis
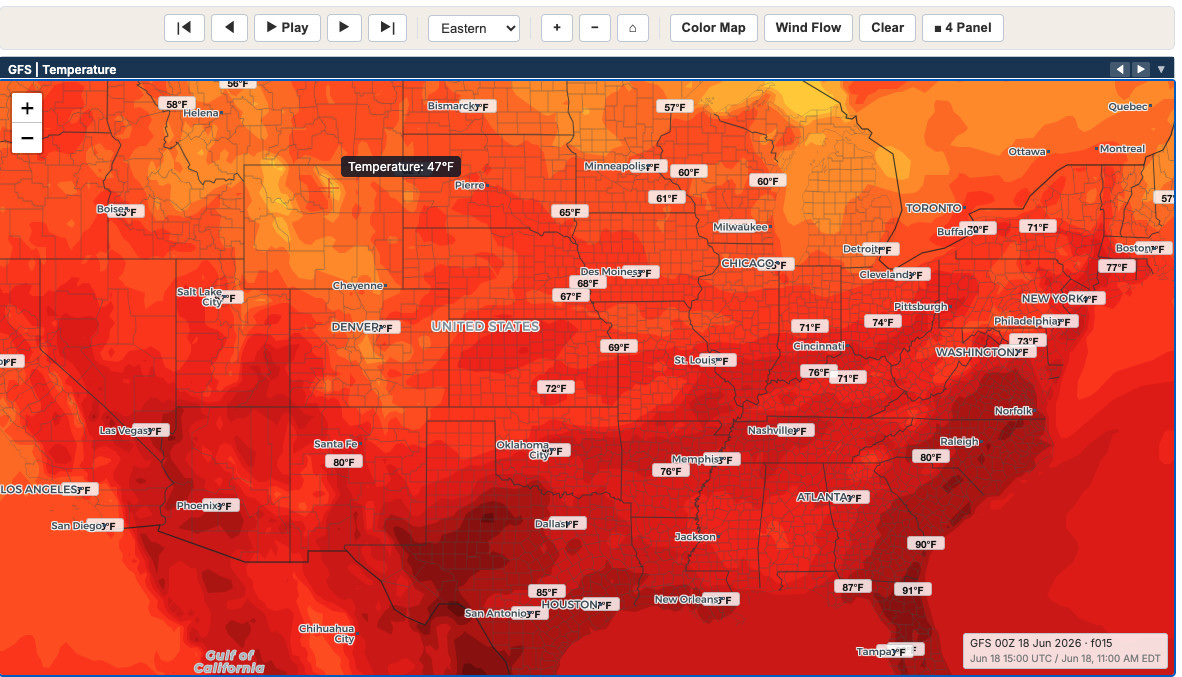
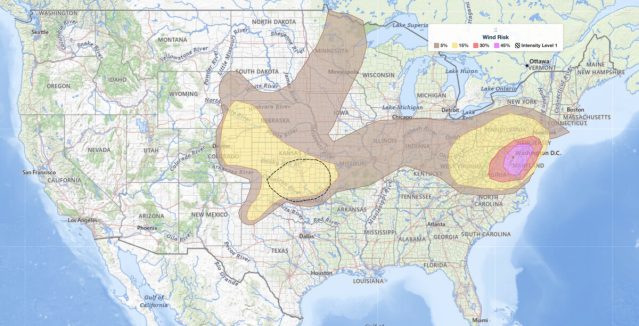
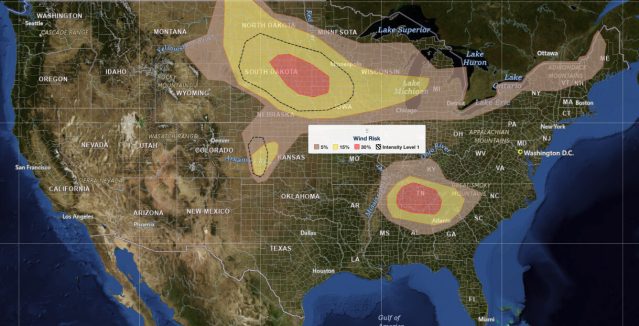
Model Analysis lets you compare forecast guidance from GFS, HRRR, ECMWF, and IFS across the fields that drive a forecast: temperature, dewpoint, wind, precipitation, CAPE, MSLP, plus upper-air layers like 500 mb heights, 500 mb vorticity, 250 mb wind, and 850 mb temperature and wind.
View a single panel, or put four panels side by side to compare models and parameters at once. Choose a regional focus (Eastern, Central, Mountain, Pacific, Alaska, or Hawaii), use Quick Load to jump to a setup, and switch between a color map and wind-flow rendering. The viewer is built to load fast and stay responsive as you step through forecast hours.
Model data comes from NOAA (GFS and HRRR) and ECMWF IFS Open Data.
Hurricane Tracker
Track active Atlantic and East Pacific systems with the live National Hurricane Center forecast cone, track, and coastal watches and warnings. The map updates with each NHC advisory, so what you see reflects the latest official guidance.
Toggle the layers you need: forecast track and points, watches and warnings, storm surge zones (1–3, 3–6, 6–9, and greater than 9 ft), the wind field (34, 50, and 64 kt), and past track. A satellite underlay in infrared, GeoColor, or visible puts the storm in context.
New this season is a video briefing tool for social media and broadcast. Build a downloadable, shareable video of a storm in vertical (9:16) for TikTok, Shorts, and X, or landscape (16:9) for YouTube. Add scenes, frame the map region you want, and stamp each scene with UTC and local time. Free accounts can test it with a watermark; premium accounts export a clean, full video.
Storm Reports
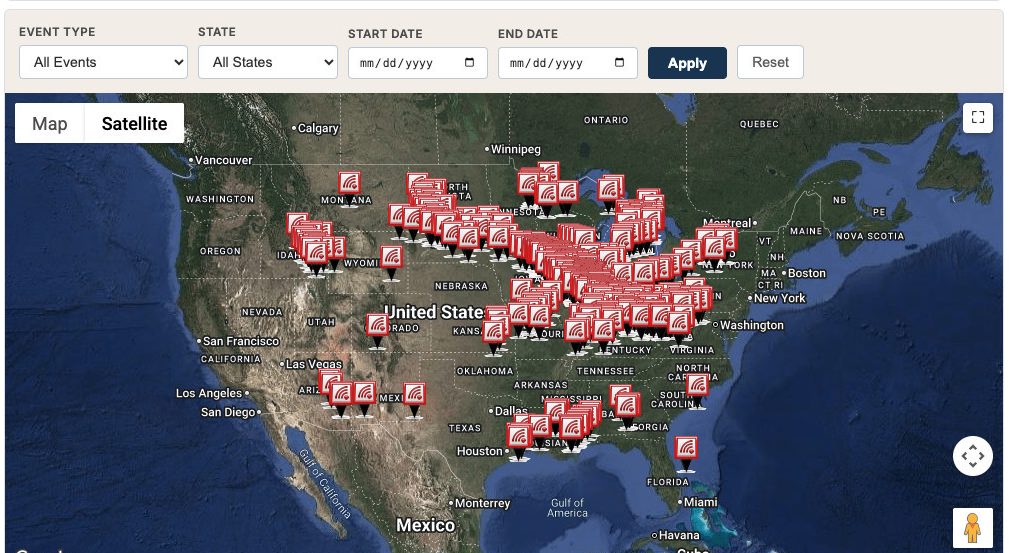
Browse official storm spotter reports, including hail size, wind speed, tornado touchdowns, and flooding, mapped across the United States. Filter by event type, state, and date range, and sort the list by time, location, event, or source.
Report history is now archive-backed, so you can pull events from beyond the recent window, up to a 30-day range per view. A copy-link button lets you share an exact filtered map, with your event, state, and date selections preserved. Storm report data is provided by WxData.com.
Free Weather Analysis Tools, More With an Account
Every tool above is free to use, and a free iAlert account lets you test the premium features, including the video export tools, on each of these weather analysis tools. Premium members get full access: clean, full-resolution video exports and iAlert’s text and email alerting services. See the full lineup on the services page.
iAlert is expanding its weather analysis tools quickly, with new features added often. Bookmark iAlert.com for the latest weather analysis tools.