Wondering whether yellow dust from Asia actually reaches the United States, when tornado season peaks and why, what beach warning flag colors mean for your safety, what NOAA Climate Normals are and why “warmer than normal” references them, or what a weather anomaly means on a forecast map? Few weather terms begin with Y, but they cover some of the most useful context for understanding seasonal weather patterns, climate baselines, and year-round severe weather risk.
Jump to weather terms beginning with the letter:
A | B | C | D | E | F | G | H | I | J | K | L | M | N | O | P | Q | R | S | T | U | V | W | X | Y | Z
Get Severe Weather Alerts for Your Location
When any NWS watch, warning, or advisory is issued for your area, iAlert sends you an immediate notification by email or text, 24 hours a day, 7 days a week.
Sign Up for Severe Weather Alerts →Weather Terms Beginning with “Y”
Yellow Dust (Asian Dust)
Yellow dust, also called Asian dust or Asian sand, is a seasonal weather and air quality phenomenon in which vast quantities of fine dust and sand particles are swept up from the Gobi Desert and other arid regions of northern China and Mongolia by powerful spring windstorms, lofted to altitudes of 5,000-15,000 feet, and carried eastward by the jet stream across thousands of miles of Pacific Ocean. These transcontinental dust plumes can reach the western United States, primarily California, Oregon, Washington, and occasionally further inland, typically from March through May when spring windstorms over the source regions are most intense. When yellow dust arrives in the US, it can elevate PM10 and PM2.5 airborne particle concentrations to unhealthy or very unhealthy levels for sensitive groups, including people with asthma, COPD, or cardiovascular disease, even on days when no local pollution sources are active. The dust also carries agricultural pesticide residues, heavy metals, and biological particles including bacteria and fungal spores from the source regions, some of which may contribute to respiratory illness in affected downwind populations. NOAA’s Air Resources Laboratory uses its HYSPLIT (Hybrid Single Particle Lagrangian Integrated Trajectory) model to track long-range atmospheric transport events including transpacific yellow dust plumes.
Year-Round Severe Weather Calendar
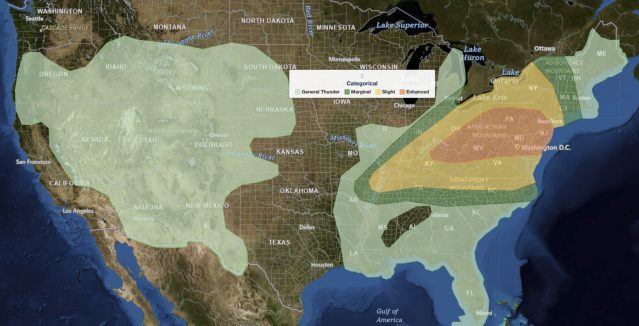
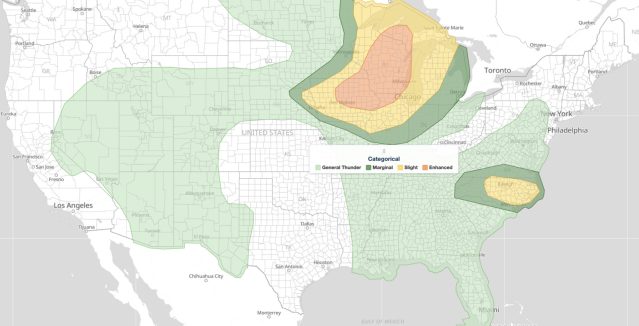
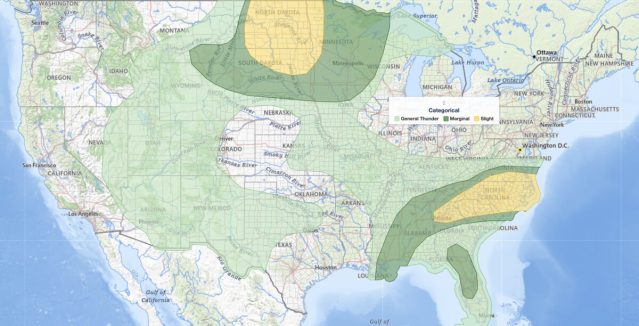
Severe weather in the United States is not limited to a single “season”, significant life-threatening weather threats exist in every month of the year, with different hazards dominating in different seasons and regions. The US severe weather calendar: January through March brings ice storms, nor’easters, Arctic cold outbreaks across the northern Plains and Midwest, plains blizzards, and Pacific atmospheric rivers delivering extreme rainfall to the West Coast. April through June is peak severe thunderstorm and tornado season across Tornado Alley and the Southeast, with flooding from snowmelt combined with heavy rain across the Mississippi and Missouri river valleys. July and August see widespread dangerous heat across the South and West, Southwest monsoon season with flash flooding in Arizona and New Mexico, Great Plains severe weather continuing, and the peak of the Atlantic hurricane season approaching. September and October feature the statistical peak of Atlantic hurricane season, early-season snowstorms in the Rockies and northern Plains, fire weather season at its most extreme in the West, and a secondary severe weather season in the Southeast. November and December see early-season winter storms affecting the South, lake effect snow season reaching its peak around the Great Lakes, nor’easters beginning along the East Coast, and offshore Pacific storm systems returning to the Northwest.
See also: Tornado Safety | How tornadoes form | Winter Storms, A Preparedness Guide
| Season | Primary Threat | Most Affected Region |
|---|---|---|
| Winter (Dec-Feb) | Blizzards, ice storms, Arctic cold, nor’easters | Northern Plains, Great Lakes, Northeast |
| Early Spring (Mar-Apr) | Flooding from snowmelt, severe thunderstorms begin | Mississippi Valley, Plains, Appalachians |
| Late Spring (Apr-Jun) | Peak tornado season, large hail, severe thunderstorm outbreaks | Tornado Alley (OK, KS, TX, NE) |
| Summer (Jun-Aug) | Heat waves, flash flooding, monsoon thunderstorms | Southwest (heat/monsoon), Southeast (heat/humidity) |
| Late Summer/Fall (Aug-Oct) | Peak Atlantic hurricane season, fire weather in West | Southeast/Gulf Coast (hurricanes), California (fires) |
| Early Winter (Nov-Dec) | Early-season snowstorms, lake effect snow, nor’easters begin | Great Lakes, Northeast, Appalachians |
Yellow Flag (Beach Safety)
The yellow warning flag is part of the standardized beach warning flag system used on US and many international beaches to communicate current hazard conditions to swimmers, surfers, and beachgoers without requiring words. A Yellow Flag means “caution, medium hazard conditions” are present, which may include moderate surf heights, possible rip currents forming, or other conditions that require swimmers to exercise heightened caution and stay close to shore. The full US beach flag system: Green Flag means low hazard and calm conditions, the safest swimming conditions; Yellow Flag means moderate hazard, use caution, be alert for rip currents; Red Flag means high hazard, dangerous surf or strong rip currents, corresponding to an NWS High Surf Advisory or Rip Current Warning, only experienced swimmers in strong physical condition should enter; Double Red Flag means the water is closed to all swimmers due to life-threatening conditions; Purple Flag means dangerous marine life (jellyfish, stinging creatures, sharks) have been observed and are present. Flags may be combined, a Red and Purple flag simultaneously means dangerous currents AND marine life hazards. Always check beach flags before entering the water, regardless of how calm conditions may appear from shore.
See also: Rip Current Safety
Climate Normals
NOAA Climate Normals are official 30-year average statistics for temperature, precipitation, snowfall, and dozens of other climate variables computed for thousands of weather stations across the United States and worldwide. They are recalculated and officially updated every 10 years using the most recent complete 30-year period; the current operational normals are based on data from 1991-2020. Climate Normals serve as the universal baseline for comparing current weather conditions to “normal”, when a forecast says temperatures will be “10 degrees above normal,” it means 10 degrees above the 30-year average for that location and calendar date. Normals are used by a remarkably wide range of industries and applications: agricultural planning and crop insurance, building energy codes and HVAC system sizing, utility company load forecasting, water resource management, airport design, insurance risk assessment, and climate change research. NOAA publishes above-normal, near-normal, and below-normal departure maps showing which regions are experiencing anomalous conditions relative to the 30-year baseline, used in both weather outlooks and climate monitoring.
Year in Weather (Annual Climate Summary)
NOAA’s National Centers for Environmental Information (NCEI) publishes comprehensive annual climate reports ranking each year’s US and global temperature and precipitation relative to the full historical record, dating to 1895 for the contiguous US and 1850 for global surface temperatures. A year in which the contiguous US average temperature ranks in the top 10 warmest on record is designated “much warmer than average”; rankings in the top 3 represent “record warmth” territory. Separately, NOAA publishes the Annual US Billion-Dollar Weather and Climate Disasters report, which documents every weather event of the year that individually caused $1 billion or more in direct economic damages (adjusted to current-year dollars for comparability). In 2023, there were 28 separate billion-dollar disasters, the most in a single calendar year on record, totaling over $92 billion in damages and 492 direct deaths. Disaster types include tropical cyclones, severe thunderstorm outbreaks (tornadoes and hail), flooding events, winter storms and cold waves, wildfires, and drought. The annual tracking of billion-dollar disaster frequency is one of the clearest long-term indicators of increasing extreme weather frequency and intensity.
Traditional Ecological Knowledge and Weather
Traditional Ecological Knowledge (TEK), including the weather and environmental observation systems developed by indigenous peoples such as the Yup’ik of Alaska, the Inuit of the Arctic, and Native American communities across the continental US, represents centuries of localized observation of weather patterns, ice conditions, seasonal cycles, and environmental changes that often cannot be captured by the sparse instrumental record. Yup’ik communities in coastal western Alaska, for example, have developed detailed traditional knowledge of sea ice behavior, wind patterns, and storm surge risk that integrates observations spanning many human generations, extending the effective climate record far beyond the 100-150 years of modern instrumental data. NOAA and the NWS actively collaborate with Alaska Native communities through co-production programs to integrate Traditional Ecological Knowledge with modern meteorological observations, particularly for sea ice extent and quality forecasting critical to subsistence hunting and community safety, and for understanding the rapid environmental change occurring in the Arctic at a pace outstripping the ability of the sparse Alaskan observing network to fully document. Indigenous communities in coastal and riverine environments often possess the most detailed and precise local knowledge of flood risk, storm surge patterns, and ice hazards of any source available to emergency managers.
Weather and Climate Anomaly
A weather or climate anomaly is the departure, either positive or negative, of an observed weather measurement or climate variable from its long-term average (the Climate Normal). Anomalies are typically expressed as degrees above or below normal for temperature, or inches or percent above/below normal for precipitation. A “positive temperature anomaly” means warmer than the 30-year average; a “negative precipitation anomaly” means drier than average. Large-scale anomaly patterns spanning months to seasons are driven by well-understood climate patterns: ENSO (El Nino/La Nina cycles in the tropical Pacific), the Arctic Oscillation (AO) and its closely related North Atlantic Oscillation (NAO), the Pacific Decadal Oscillation (PDO), and the Atlantic Multidecadal Oscillation (AMO). NOAA’s Climate Prediction Center uses the current state of these climate patterns to issue 30-day and 90-day temperature and precipitation outlooks showing probability of above-normal, near-normal, or below-normal conditions by region. The global average surface temperature anomaly for 2023 was approximately +1.45 degrees C above the pre-industrial baseline, making 2023 the warmest year in the 174-year instrumental record, surpassing the previous record by the largest margin ever recorded for a single year.
Severe Weather Alerts, Any Location, Any Time
From a Rip Current Warning to a Tornado Warning, iAlert monitors every NWS alert and notifies you the moment one is issued for your area. Set up alerts for home, work, school, or anywhere your family is.
Get Weather Alerts →Frequently Asked Questions, “Y” Weather Terms
What is yellow dust and does it reach the United States?
Yellow dust is a seasonal air quality and weather phenomenon where strong spring windstorms over the Gobi Desert and other arid regions of East Asia lift enormous quantities of fine dust particles into the atmosphere. The jet stream carries this dust thousands of miles across the Pacific Ocean, and it can reach the western US, primarily California, Oregon, and Washington, typically from March through May. Concentrations can reach unhealthy levels for people with respiratory conditions. The dust also carries agricultural chemicals, heavy metals, and biological particles from source regions. NOAA’s Air Resources Laboratory tracks these long-range transport events.
Is there really a “tornado season” and when is it?
Yes, the peak of US tornado season is April through June, centered on Tornado Alley (Oklahoma, Kansas, Texas, Nebraska) and Dixie Alley (Mississippi, Alabama, Tennessee). The combination of warm, moist Gulf air, dry desert air, and cold Arctic air meeting along fronts in spring creates the optimal conditions for supercell thunderstorms. However, tornadoes have occurred in every month of the year and in every US state. A secondary peak occurs in the Southeast in November and December. The deadliest tornado in modern US history (Joplin, MO, May 22, 2011) occurred at the peak of tornado season.
What do beach warning flag colors mean?
The standardized beach warning flag system communicates hazard levels: Green means low hazard, calm conditions; Yellow means moderate hazard, exercise caution, possible rip currents; Red means high hazard, dangerous surf or strong currents, often corresponding to an NWS Rip Current Warning; Double Red means the beach is closed to swimming; Purple means dangerous marine life (jellyfish, stinging creatures) are present. Flags can be combined, a Red flag and Purple flag together mean dangerous currents AND marine life hazards. Check the flags before entering the water.
What are NOAA climate normals?
NOAA Climate Normals are official 30-year averages of temperature, precipitation, and other climate variables calculated for thousands of weather stations across the US and worldwide. They are updated every 10 years, the current normals are based on data from 1991-2020. When a weather forecast says “10 degrees above normal,” it means 10 degrees above this 30-year average. Climate Normals are used to set baseline expectations for agriculture, energy demand, building design, and water resource planning. They are also the reference standard for climate change research, showing how today’s conditions compare to the historical baseline.
What are NOAA’s billion-dollar disaster reports?
Each year, NOAA’s National Centers for Environmental Information (NCEI) publishes the US Billion-Dollar Weather and Climate Disasters report, cataloging every weather event that caused $1 billion or more in damages, adjusted to today’s dollars. In 2023, there were 28 such events, the most in a single year on record, totaling over $92 billion in damages. These reports are used by insurers, government agencies, emergency managers, and climate researchers to track trends in extreme weather frequency and cost. Hurricanes, severe thunderstorm outbreaks, flooding events, and wildfires dominate the list.
What is a weather anomaly?
A weather anomaly is the difference between an observed weather value and the long-term average (the 30-year Climate Normal) for that location and time of year. A temperature anomaly of +5 degrees F means it was 5 degrees warmer than the 30-year average for that date. Anomaly maps show which regions are running above or below normal, useful for identifying large-scale patterns driven by El Nino, La Nina, or other climate factors. The global average surface temperature anomaly for 2023 was approximately +1.45 degrees C above the pre-industrial baseline, making 2023 the warmest year in the 174-year instrumental record.
Never Miss a Severe Weather Alert
iAlert monitors National Weather Service watches, warnings, and advisories around the clock and sends you an immediate notification the moment your area is threatened. Works for any U.S. location.
View All Alert Services → Severe Weather Alerts →Related Articles
- Get real-time Severe Weather Email & Text Alerts
- Hot Weather Survival Tips in Extreme Summer Heat
- Protection Against Extreme High Temperatures
- NOAA 2025 Atlantic Hurricane Season Forecast
- Severe Weather Preparedness
- Tornado Safety
- How tornadoes form
- Tornado facts
- Rip Current Safety
- Understanding the NWS Severe Weather Outlook
- WxData.com, Weather Data API for apps and systems