

Severe Weather Outlook Periods
Convective outlooks are divided into four periods:| Day 1 | The risk of severe weather today through early morning of the following day. Day 1 forecasts are issued five times daily: 06z (around midnight), 13z (around sunrise), 1630z (mid-morning), 20z (mid-afternoon), and 01z (early evening). |
|---|---|
| Day 2 | Day 2 continues from the end of Day 1 (tomorrow morning) for the next 24 hours. Issued twice daily: 07z (around midnight) and 1730z (around noon). |
| Day 3 | The forecast for the subsequent 24 hours. Day 3 forecasts are issued daily by 0830z on standard time and 0730z on daylight time (after midnight). |
| Days 4–8 | A severe weather area depicted in the Day 4–8 period (issued at 10z, early morning) indicates a 30% or higher probability of severe thunderstorms (a 30% chance that a severe thunderstorm will occur within 25 miles of any point). |
Severe Weather Outlook Risk Categories
The severe weather outlook graphics display up to six color categories reflecting an increasing likelihood and/or severity of severe weather.
General Thunderstorms
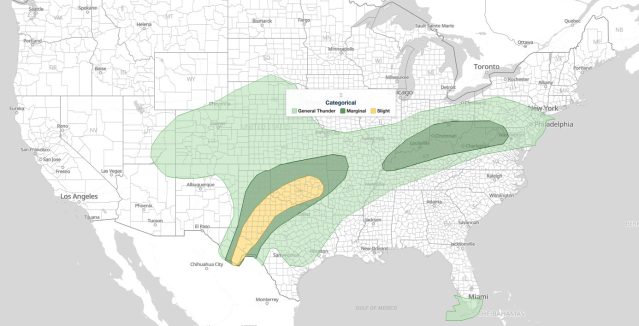
The light green shading depicts a 10% or higher probability of non-severe or near-severe thunderstorms during the valid period.
Severe Category 1 – Marginal (MRGL)
The dark green shading indicates a marginal risk of severe thunderstorms during the forecast period. This means a:- 2% or greater tornado probability, or
- 5% probability of severe hail (≥1″) or severe wind (≥58 mph / 93 km/h)
Severe Category 2 – Slight (SLGT)
The yellow shaded area indicates a slight risk of severe thunderstorms during the forecast period. This means a:- 5% or greater tornado probability, or
- 15% probability of severe hail or severe wind, with or without a 10% or greater probability of hail 2″ or larger or wind gusts 75 mph or greater (120 km/h or greater)
Severe Category 3 – Enhanced (ENH)
The orange shaded area indicates an enhanced risk of severe thunderstorms during the forecast period. This means a:- 10% probability of any tornado, with or without a 10% or greater probability of an EF2+ tornado, or
- 15% probability of any tornado, or
- 30% severe hail or severe wind probability, with or without a 10% or greater probability of hail 2″ or larger or wind gusts 75 mph or greater, or
- 45% probability of severe hail or wind
Severe Category 4 – Moderate (MDT)
The red shaded area indicates a moderate risk of severe thunderstorms. This means a:- 15% tornado probability and a 10% or greater probability of an EF2+ tornado, or
- 30% probability of any tornado, or
- 45% severe wind probability and a 10% or greater probability of wind gusts 75 mph or greater, or
- 45% severe hail probability and a 10% or greater probability of hail 2 inches or larger, or
- 60% severe wind probability, or
- 60% severe hail probability, with or without a 10% or greater probability of hail 2 inches or larger
Severe Category 5 – High (HIGH)
The fuchsia shaded area indicates a high risk of severe thunderstorms. This means a:- 30% tornado probability and a 10% or greater probability of an EF2+ tornado, or
- 45% or greater probability of any tornado, with or without a 10% or greater probability of an EF2+ tornado, or
- 60% severe wind probability and a 10% or greater probability of wind gusts 75 mph or greater
Get Severe Weather Alert Notifications
Get real-time email, text, and voice call notifications when a Tornado Watch, Tornado
Warning, Severe Thunderstorm Watch, or Severe Thunderstorm Warning is issued for your area.
Sign Up Free ›
The latest severe weather outlooks are published on the Storm Prediction Center’s official outlook
page.
Pingback: Florida Panhandle Tornado Risk: 5% Threat, Hurricane Isaias
Pingback: Southern Plains Severe Storms: 15% Wind Risk Oct 14